
“No society ever yet perished which had the will to save itself.”
Samuel Laing, ‘National Distress; Its Causes and Remedies’ (1844)
CONTENTS
The Social Democratic Party offers its warmest thanks to the creators of Energy Abundance: Matthew Kirtley, the author of the paper and Alastair Mellon, the SDP’s Regeneration spokesperson.
FOREWORD

Britain needs abundant, affordable energy.
That this Green Paper exists is a tragedy. For decades, Britain has sleepwalked into an abyss which has made us poorer, weaker, and gutted our industrial base. The heart of this is a self-induced energy crisis which has been catastrophic for our welfare and security. Britons now suffer the highest energy prices in the developed world, with our collective wealth continually drained to fund vast energy imports.
How did Britain – an energy rich nation – sink into an energy crisis? We argue below that the causes were part indifference, part profiteering and part lunacy. And it happened because of pretence: an ill-fated attempt to ignore the material world. But as we are finding out, the material world matters, production matters, and tangible needs matter.
Our elites have traded our prosperity for their own self-righteousness.
They embraced a worldview where value is unmoored from production, assets decoupled from the tangible, and where industry – the act of making and creating – is wilfully ignored. This worldview must end.
The solution to this crisis requires an intelligent reconnection to material reality. We must reverse Britain’s energy crisis. Our prosperity depends on it.
As the party of the patriotic state, the SDP commends this Green Paper as a path towards energy abundance.
William Clouston
Party Leader
Social Democratic Party
EXECUTIVE
SUMMARY
Britain is experiencing a multi-decade energy crisis, which began at the latest in 2005. This energy crisis has seen net electricity supplied continuously decrease year-on-year, which has caused real prices to rise by over 250% over the past two decades.
The true costs of this energy crisis arise through the suppression of economic activity and the reduction of productivity. We estimate that energy price growth has reduced British productivity by 10.8% over the past two decades. This has reduced economic output by a total of £3,070bn, or £146bn on an annualised basis.
We argue that the origins of the energy crisis lie in the abandonment of a planned state energy system in the early 1990s. This caused energy decision-making to be decoupled from the national economic considerations with which it is necessarily entwined.
Without a planning and coordination authority, there has been no body able to veto a catastrophic experiment that began in the 2000s: the shift en masse to intermittent renewable generation. To enable this new generation capacity, the state and energy sector converged towards a strategy of suppressing energy demand through a system of price rationing. Primarily through a system of policy and network costs, energy prices have thus risen to bring demand down to match the realities of supply that is backed by intermittent renewables.
To resolve this, we propose an emergency ten-year plan to fix Britain’s generation mix and dismantle the energy rationing system. To do this, we shall create a new vertically integrated state-owned energy monopoly named “Central Energy.”
- For the first part of the ten-year plan, Central Energy will construct 40GW of new natural gas generation and 20GW of coal generation at a capital cost of £60bn. The government shall finance this by repealing the Climate Change Act of 2008 and redirecting funds currently earmarked for “net zero” investments.
- For the second part of the ten-year plan, Central Energy will construct 40GW of new nuclear generation at a cost range of £100-140bn. The government shall finance this by issuing a tranche of 30-year bonds.
Following the ten-year plan, Central Energy will assume a key position in British economic life. It will issue annual five-year demand forecasts and capital plans for new generation capacity, working in close concert with the Bank of England and the Treasury.
Critical to this new system will be a permanent energy price identity: Central Energy will be obligated to guarantee that 10p will always entitle a bearer to 1kWh of grid electricity. We dub this permanent nominal price fix the energy credit system, since the value of the pound sterling would be tied to the provision of energy. The energy credit system will encourage growth in energy efficiency, guarantee continued reductions in real energy prices, and make it politically impossible to neglect long-term energy abundance ever again.
PART 1:
BRITAIN’S ENERGY CRISIS
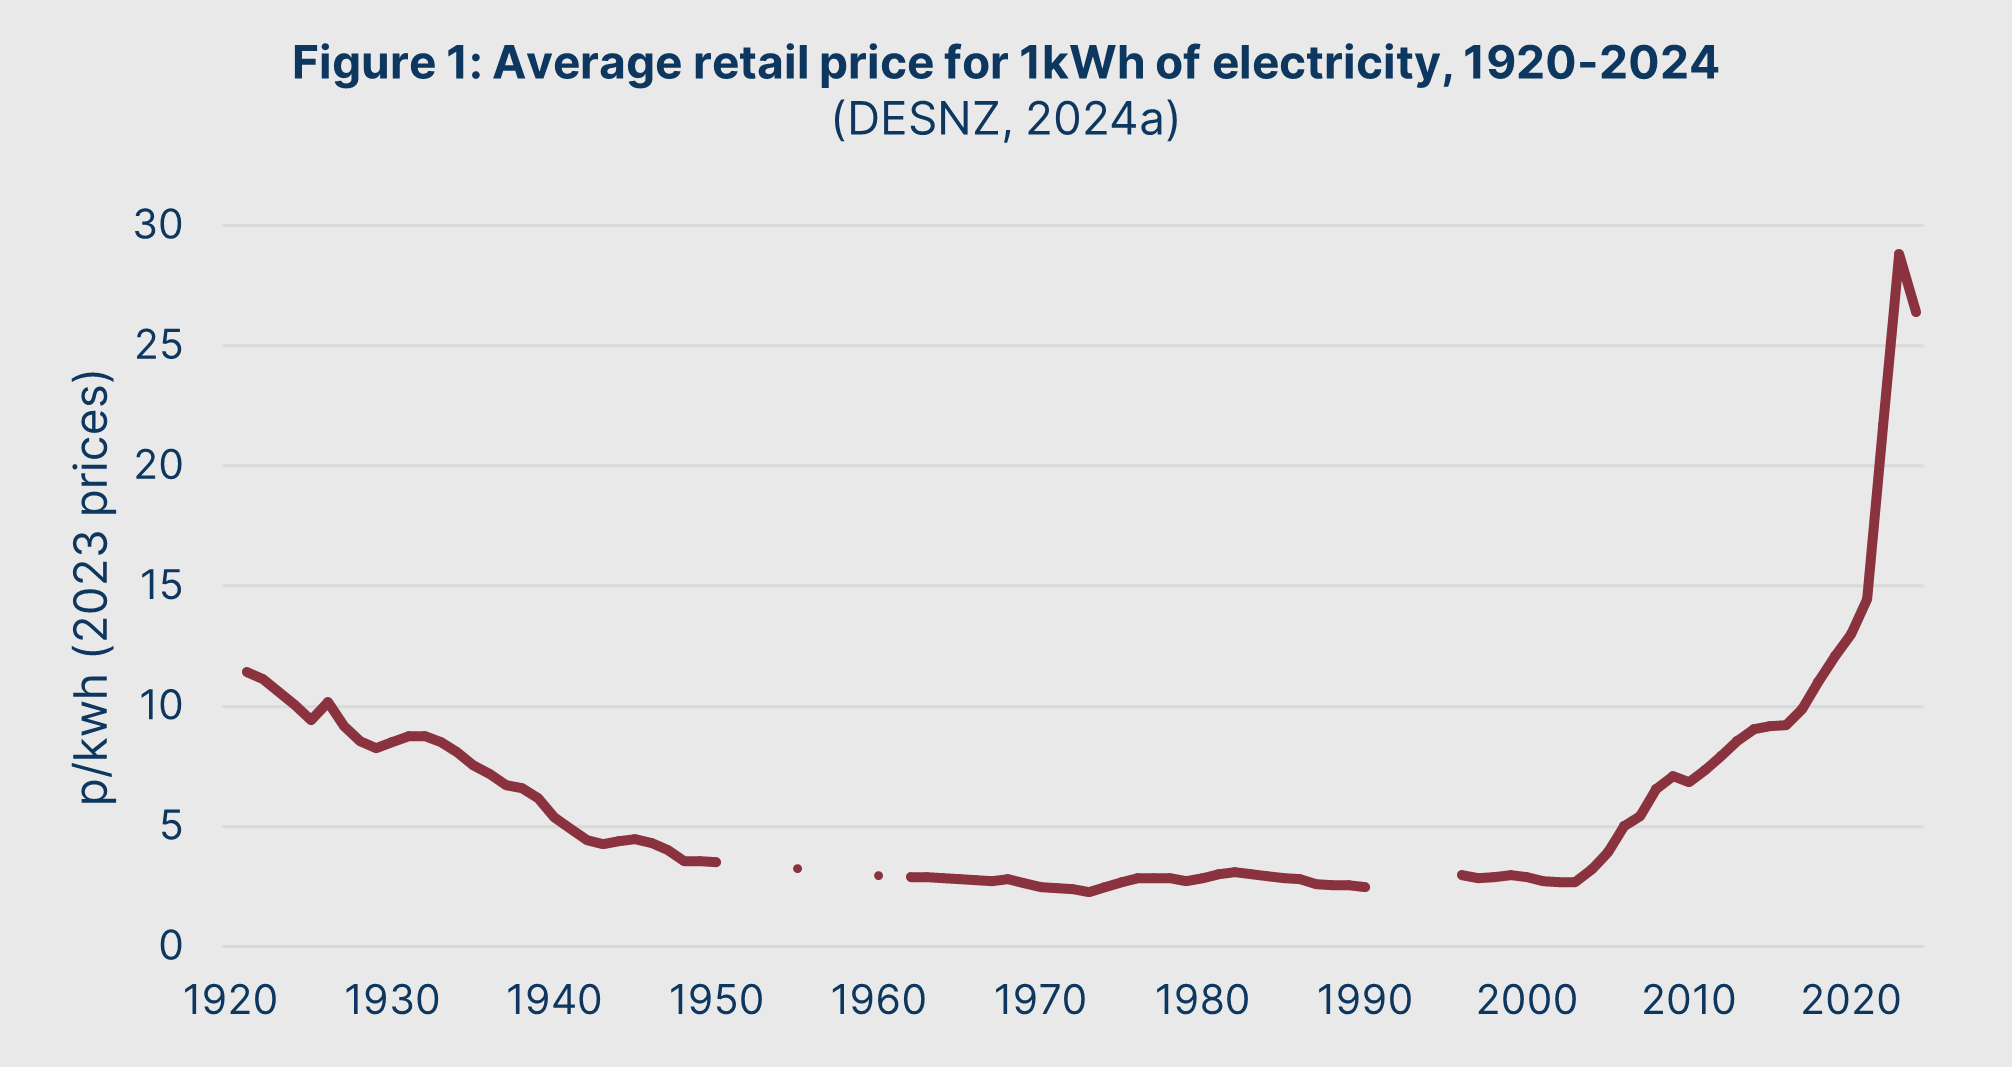
That Britain is experiencing an energy crisis can no longer be doubted. Today, our energy is the most expensive in the developed world. (ONS, 2025a)
As shown in Figure 1, British electricity prices have soared over the past two decades. Between 2004 and 2024, Britain’s industrial electricity prices rose by 262.8% in real terms, from 7.28p/kWh to 26.41p/kWh.
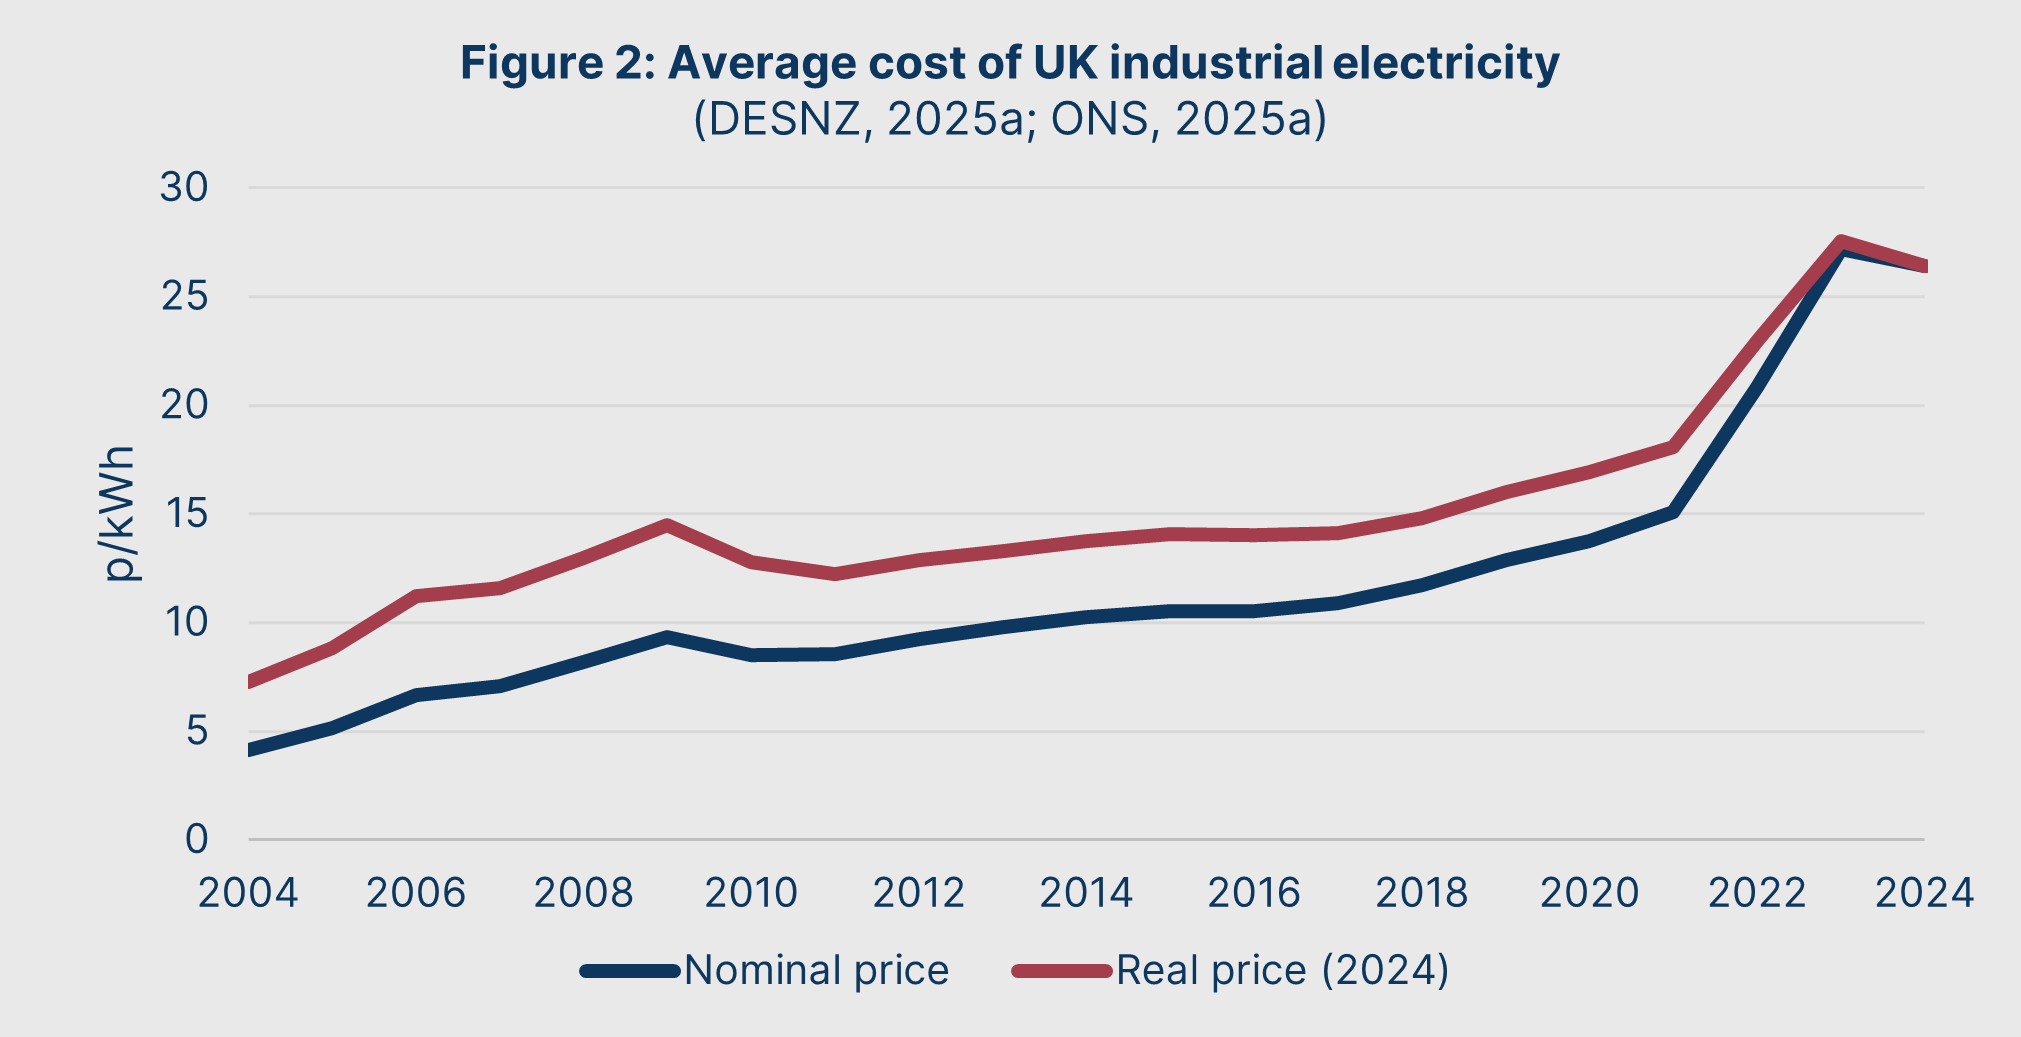
This trend did not occur all at once. Instead, it has taken place across three phases since 2004 (see Figure 2)
- Rapid real price growth of 98.8% between 2004 and 2009
- Slow real price growth of 10.7% between 2010 and 2017
- Rapid real price growth of 78.2% between 2018 and 2024
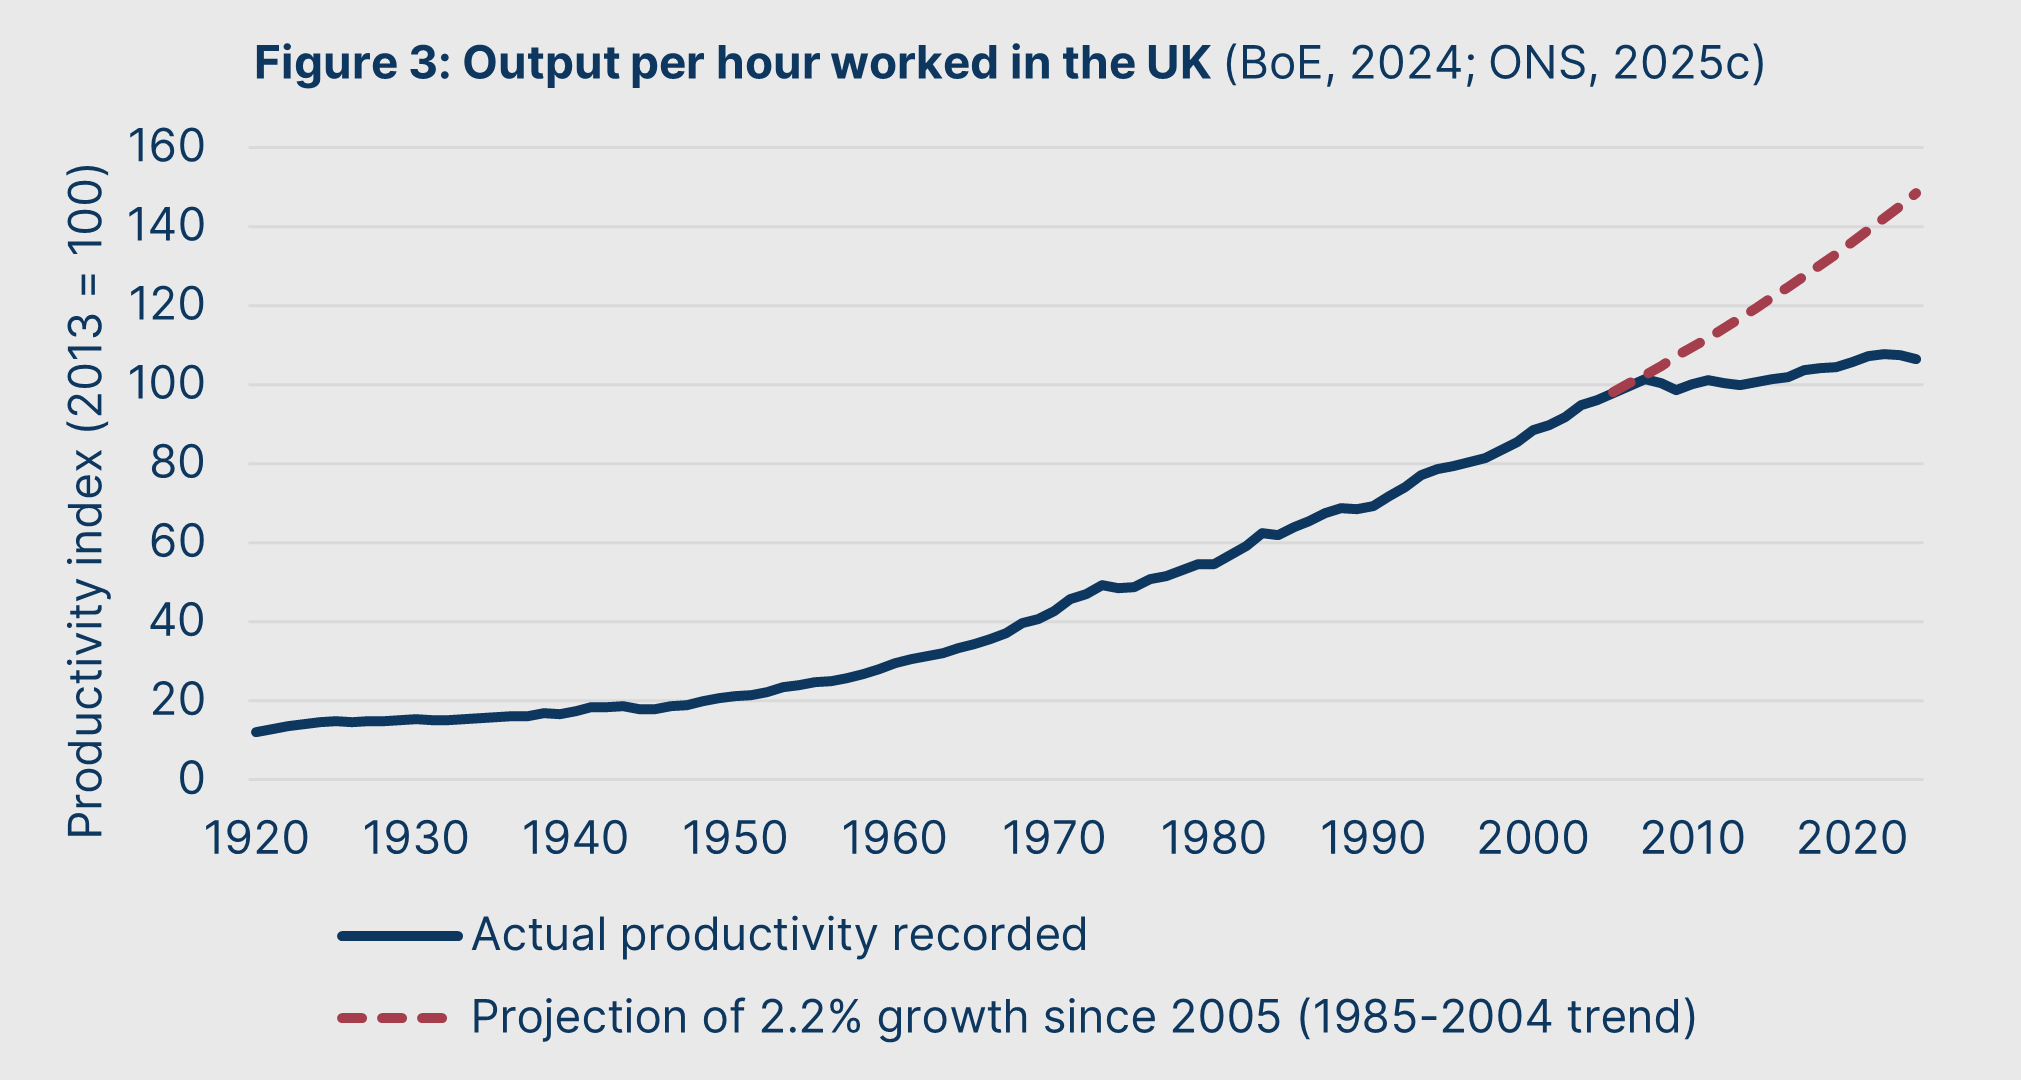
The implications of the energy crisis have proved disastrous. For years, economists and policymakers have recognised that Britain is suffering a productivity crisis, which is at the root of stagnant growth in wages and output. As shown in Figure 3, if the 1985-2004 trend in productivity growth had held following 2005, output per hour worked would be 39.4% higher than it is currently.
What has not been widely recognised is this: much of the productivity crisis can be explained as a symptom of the energy crisis.
This is because rising energy prices undermine productivity. Along with cheap electricity being critical for energy-intensive manufacturers to operate profitably, the affordability of energy influences the degree to which employers are willing to deploy labour-saving technology and capital goods.
Figure 4 illustrates this in the starkest terms: total electricity supplied peaked in 2005, and has since plummeted by 25.9%. In this context, it is unsurprising that productivity has not grown – what is remarkable is that productivity has merely stagnated, rather than collapsed.
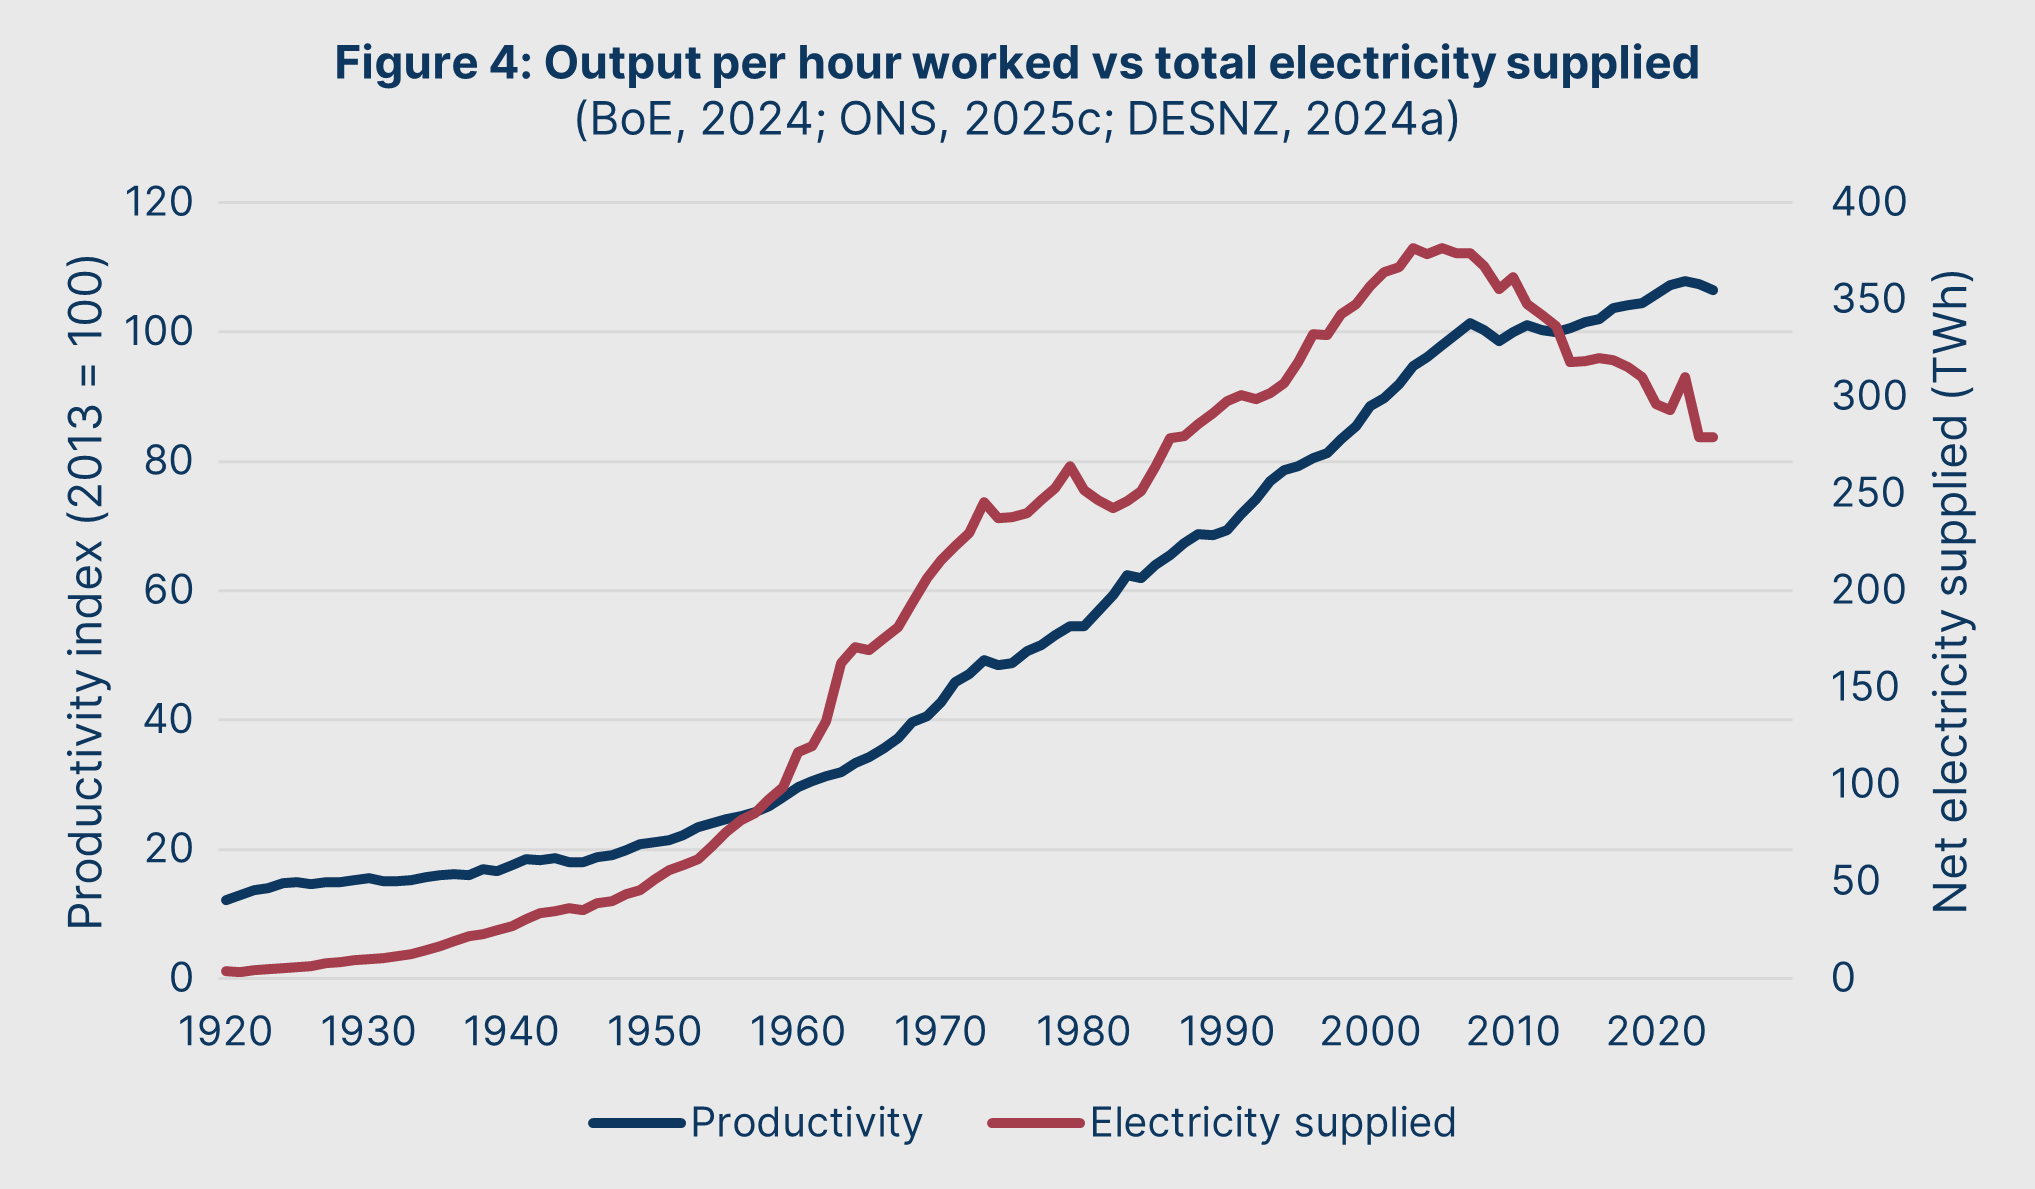
This limited supply of electricity has stunted productivity growth by reducing the uptake of labour-saving technology, and thereby reducing overall consumption, profitability, and investment. Further, it has undermined energy-intensive industries and British manufacturing. Since manufacturing has a greater economic “ripple effect” than most sectors due to a relatively high gross value-added contribution and investment multiplier, its retreat has outsized impacts on economy-wide productivity.
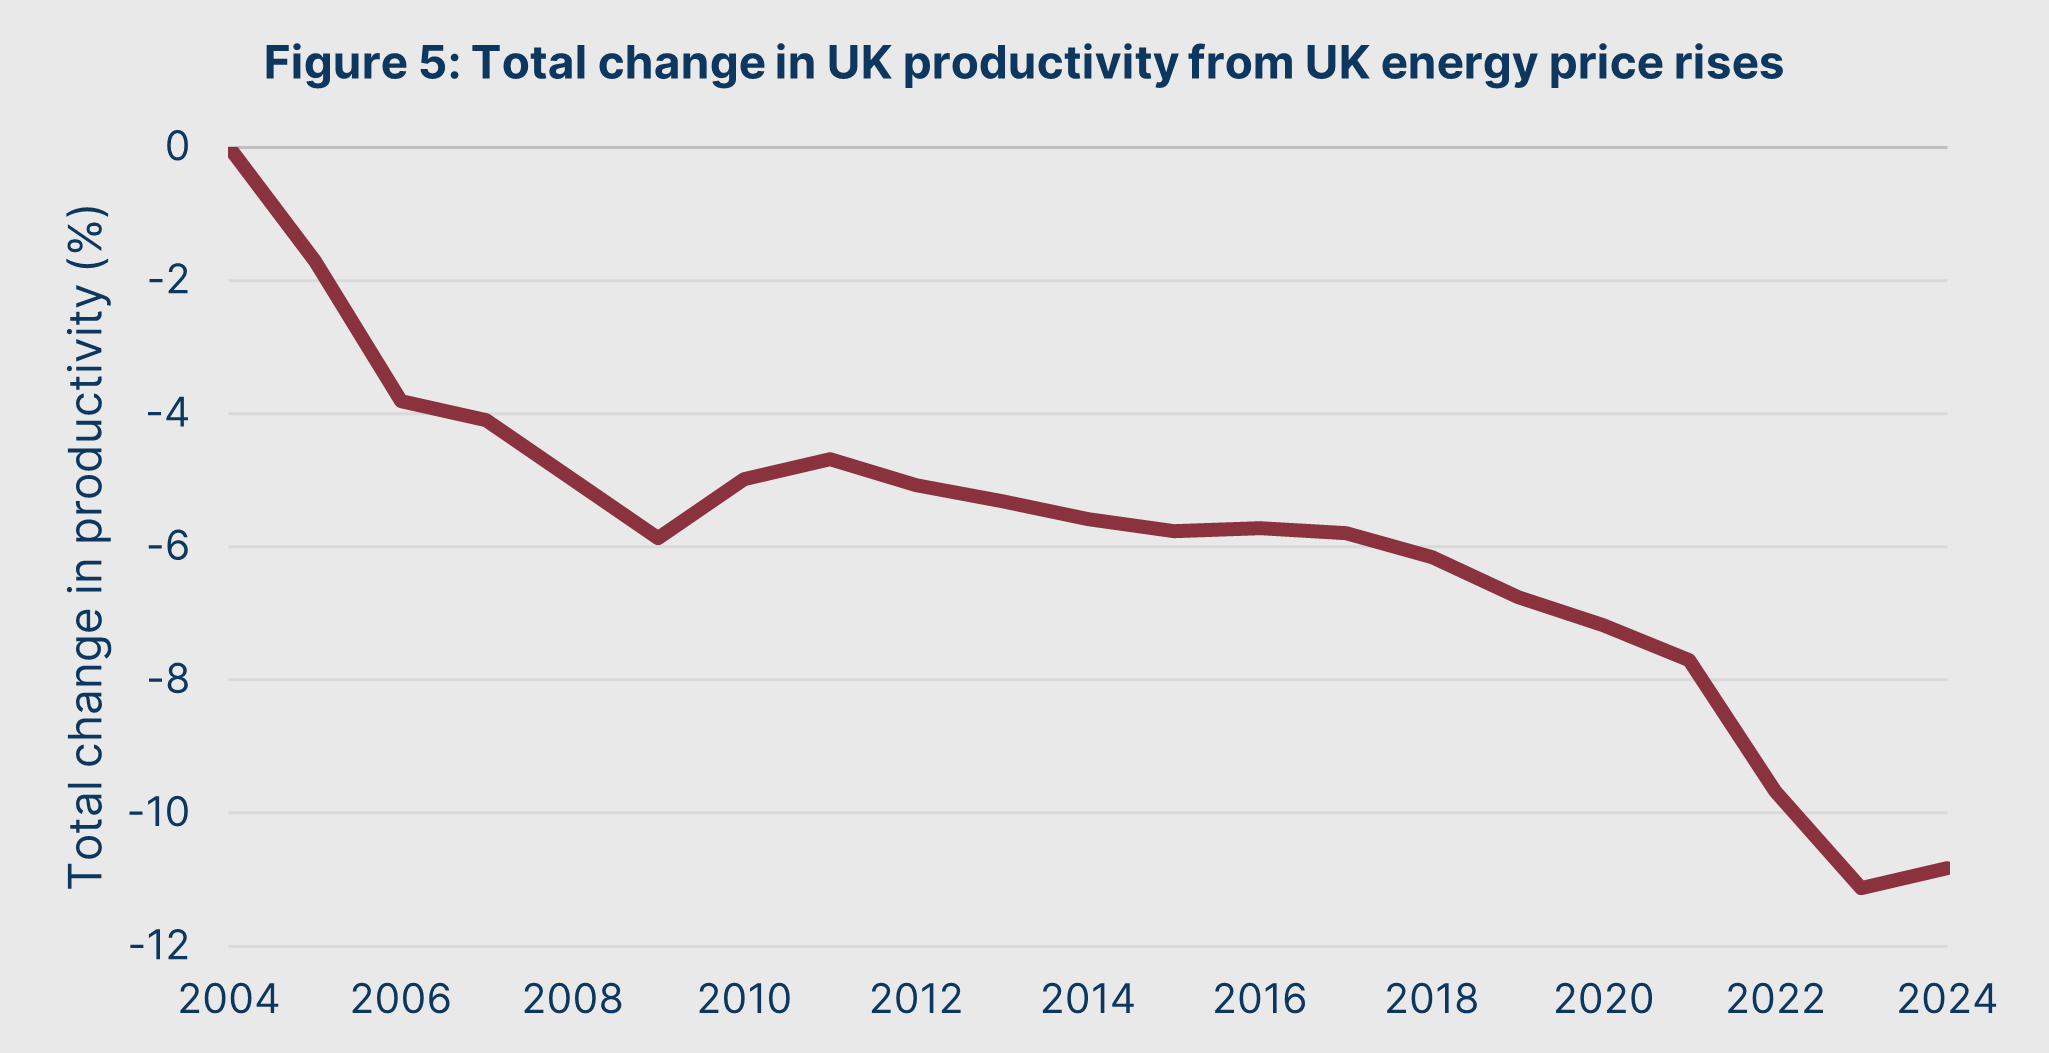
We can estimate the productivity lost directly because of the energy crisis. A recent OECD working paper estimates that a 5% rise in energy prices reduces productivity by approximately 0.4% in the following year. (André, Costa, Demmou, & Franco, 2023)
Using this relationship, we can estimate the cumulative impact of changes in energy prices on British productivity over the past two decades – this is shown in Figure 5. We calculate that the energy crisis reduced Britain’s productivity by 10.8% between 2004 and 2024.
An economy’s Gross Value Added (GVA) is equal to its total labour input, multiplied by its labour productivity. From GVA, Gross Domestic Product (GDP) is calculated by adding the total taxes paid on products and then subtracting the total amount of subsidies paid. In practice, GVA and GDP grow at virtually the same rate over time, meaning that a systematic change in GVA will have an equal impact on GDP.
This allows us to estimate Britain’s output if energy prices had not ballooned after 2004, since we can model the impact of lost productivity on GDP. Compared to the UK’s actual 2024 GDP of £2,560Bn, if real energy prices had remained constant then GDP would have instead stood at £2,870bn. (ONS, 2025d) Put bluntly: post-2004 energy price growth cost Britain £310Bn in lost output in 2024 alone.
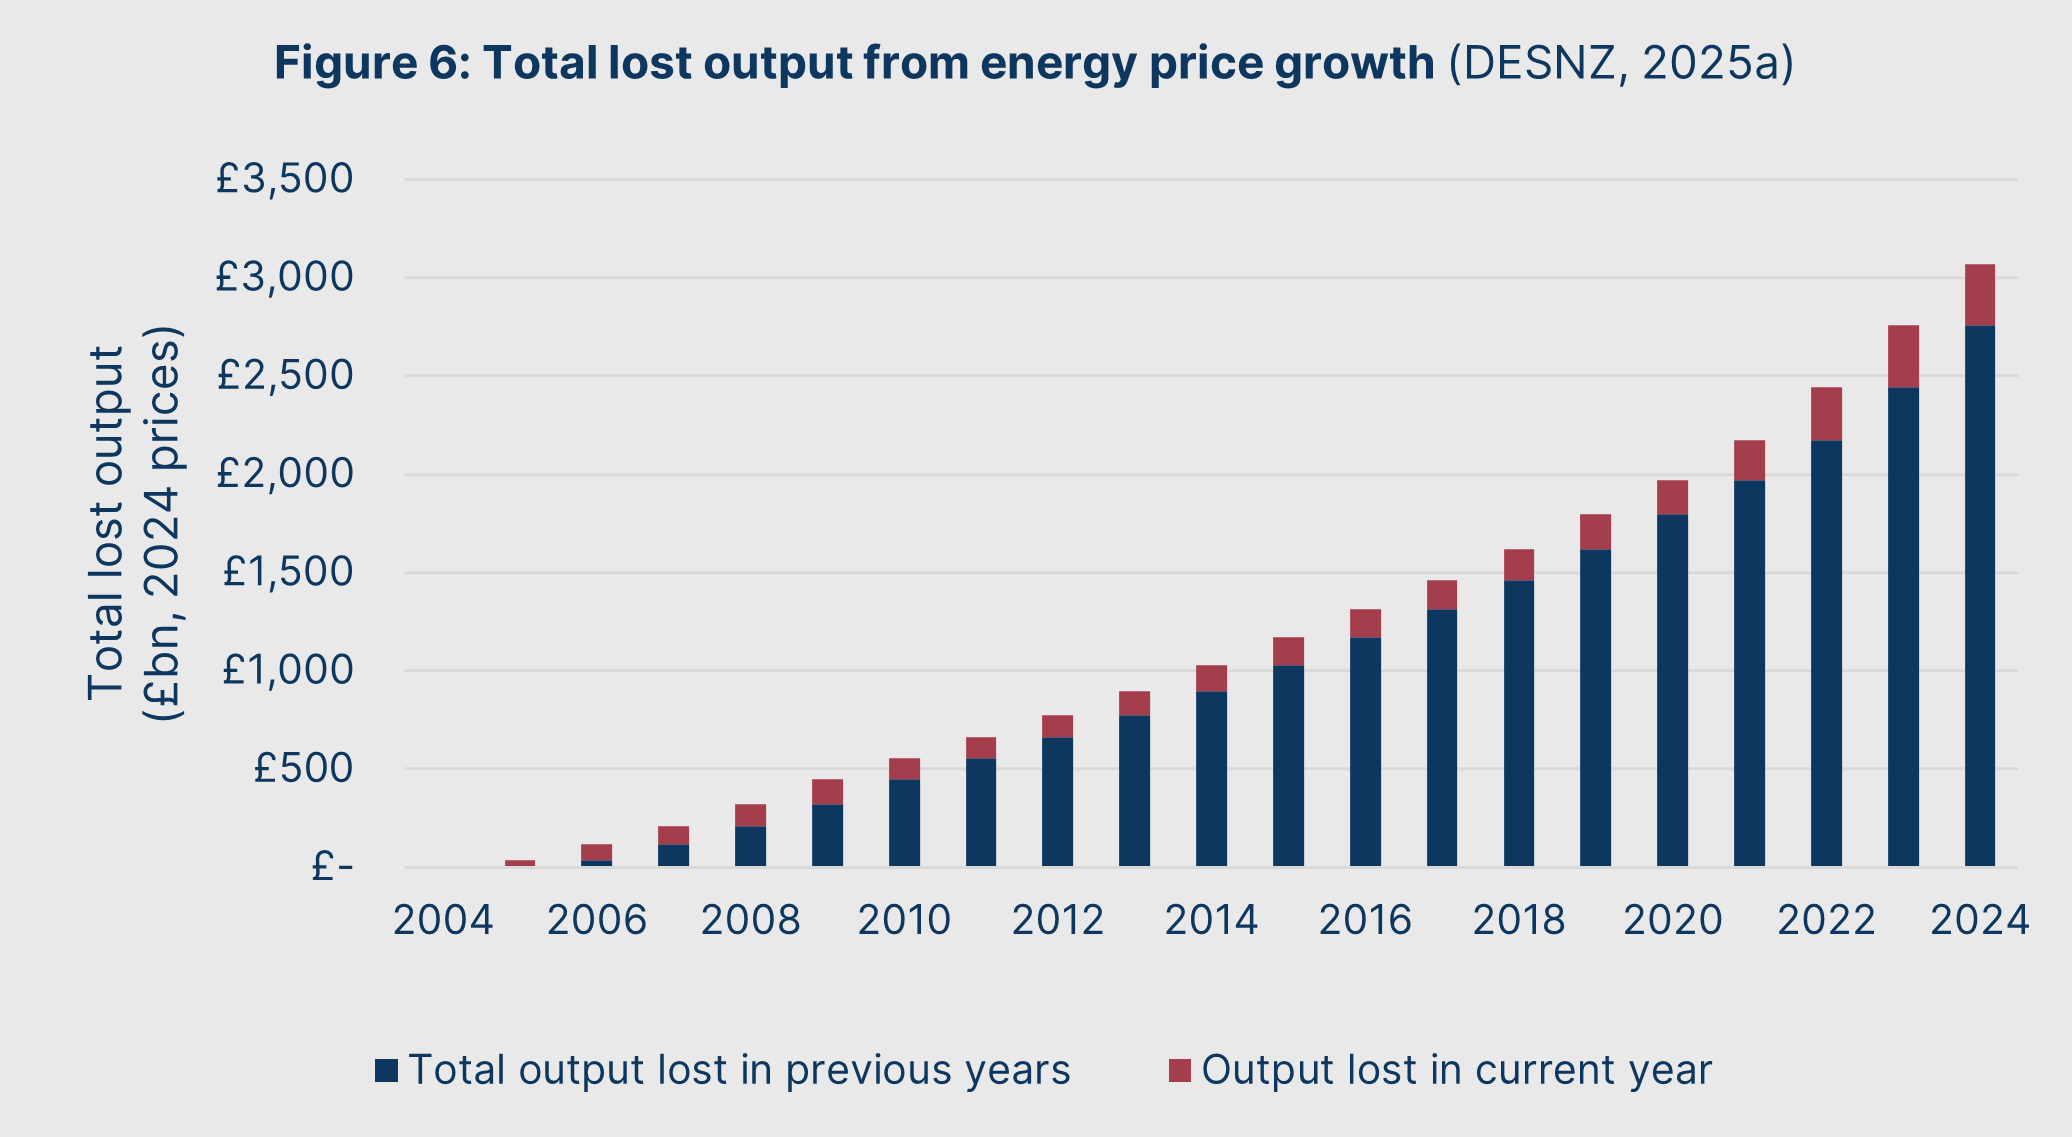
We can repeat this process for every year since 2004. This means that we can also derive the aggregate loss in output to Britain over the period, which is shown in Figure 6.
Between 2004 and 2024, rising energy prices have cost Britain an average of £146Bn every year in lost output. Total lost output stands at just over £3,070 billion, or £3 trillion – over a full year of output in 2025, or the equivalent of the full balance of the government debt.
This tremendous cost has been felt in every facet of our lives. It has manifested itself through deindustrialisation, diminished infrastructure and public services, and non-existent income growth for the past two decades. Without doubt, allowing this multi-decade energy crisis to take place has been most ruinous error in British economic history.
This Green Paper shall first establish what caused the energy crisis. Then, it shall establish some clear steps to reverse it.
The destructiveness of the energy crisis speaks for itself. By its very existence, it discredits all who have presided over it. It discredits the fashionable beliefs that have traded Britain’s prosperity for self-righteousness. It discredits the legions of “experts” who have attempted to legitimate this nonsensical system.
We are calling time on this. It is our belief that national energy policy should be guided by a simple goal: the provision of cheap, affordable, plentiful energy that facilitates growth.
PART 2:
THE CAUSES OF THE CRISIS

Electricity furnished via a grid underpins virtually all modern economic activity. Whether it be through powering a tool, a computer, a lightbulb, or a heater – most things in a society depend on grid electricity to some degree. This relationship can be seen in the link between per capita energy consumption and GDP per capita across the world’s nations, as shown in Figure 7.
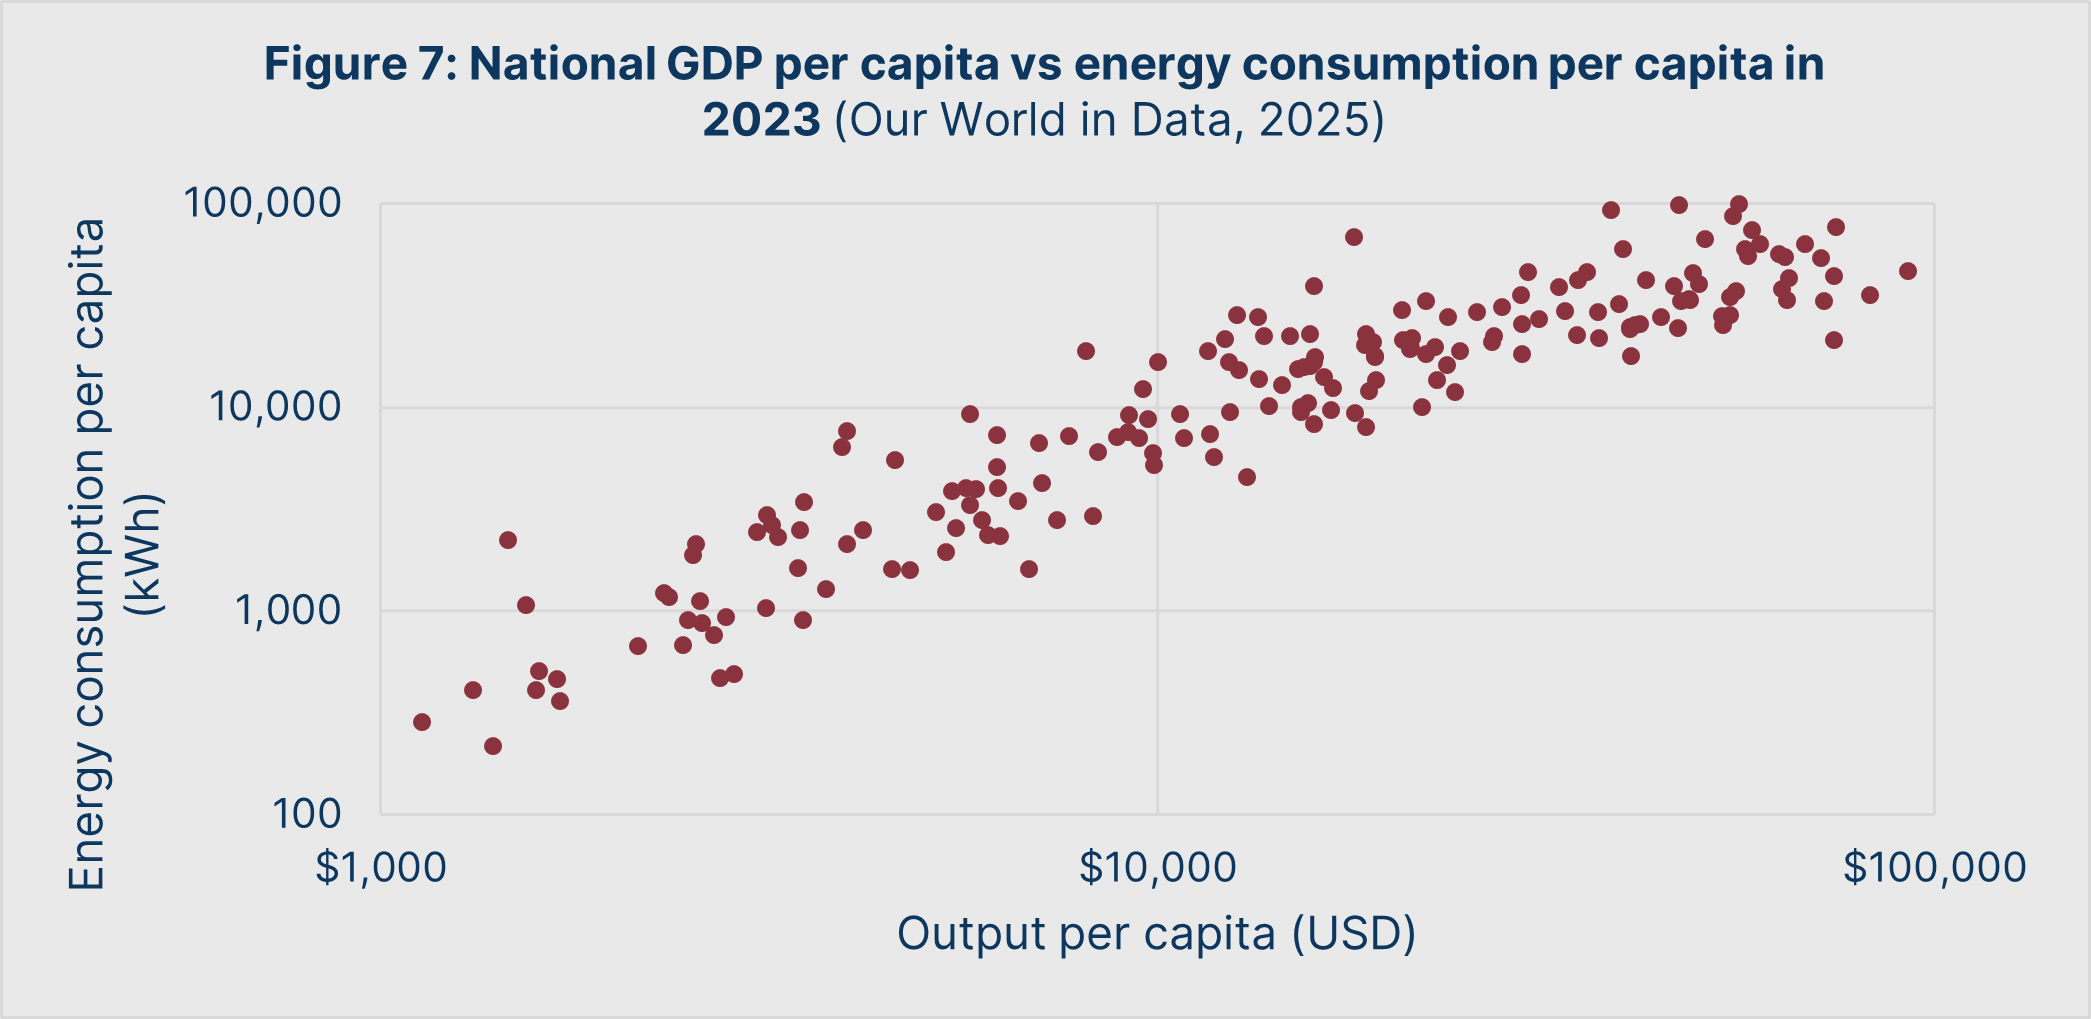
This should not be surprising. In physics, energy may be literally defined as the capacity to do work: it is the accounting system for all physical activity, with all actions being expressed in some sense as an energy exchange.
Tautologically, assuming constant energy efficiency, rising energy consumption thus indicates that more is literally being done. And if more is being done, we can reasonably assume that more value is being created. Energy consumption requires a corresponding energy supply. In this regard, societies are typically bottlenecked by one of two things: the stock of available energy (delineated in joules or watt-hours), or the flow of energy that is being put to work, that is power (delineated in joules-per-second or watts).
In the 19th century, thermal power – the use of burnable fuels to power processes via heat energy – dramatically improved available energy and power output, and thus the world’s material prosperity. But it presented new challenges.
Before the Industrial Revolution, the densest power sources available were water wheels – with the world’s most powerful water wheels having an output in the order of 50kW. By 1900, the steam turbines of Charles Parsons could output 50,000kW. However, only the largest towns and factories could make use of all this power. Electrification and grids were a solution to this challenge: plants and fuel could be fully utilised, benefit from economies of scale, and no longer needed to be right next to their customers.
Following electrification, it became clear to virtually all societies that energy – and specifically grid electricity – was now the central input for their entire economies. To this end, most of them developed energy regimes that guaranteed the viability and growth of their electricity systems. This in turn required long-term planning, as explored in detail in Discussion 1.
The ultimate cause of Britain’s energy crisis can be traced to a decision that has been unique among all nations: to abandon such planning.
DISCUSSION 1:
WHY SHOULD STATES BE IN THE BUSINESS OF ENERGY?
Along with the importance of guaranteeing affordable and reliable energy, electricity systems possess three properties which typically require them to be managed and planned by states.
Natural monopolies of transmission
The first is the fact that electricity networks – whether it be for national long-range transmission or regional distribution – are inherently monopolistic. There is little sense to multiplying the number of grids available to customers, which means that the middle steps of transmitting electrical power from generator to customer tend to fall into the hands of just one actor. A monopolist arises for wide-area transmission, with others existing for regional distribution.
As with all monopolies, especially for essential goods and services, this enables tremendous opportunities for profiteering from the public since there is little competitive pressure suppressing costs. More importantly, the monopolist has much less of an incentive to maintain infrastructure and install redundancies. Rather, the pressure will always be to discover “efficiencies” through cost-cutting at the expense of service reliability.
It is this final point – the importance of continuous uptime of an electrical grid – that is particularly sensitive. Grid electricity cannot be affordably stockpiled by customers, meaning that service interruptions are particularly disruptive and destructive.
Information asymmetry for customers
The second structural problem is the sheer complexity of an energy system. Once a wide area grid is established, in physical terms there’s no longer a direct and measurable relationship between a generator and a customer. Rather, the customer’s electricity comes via a transmission and distribution system whose power is inputted by countless other generators. Electrons are not branded.
As a result, electricity provision tends towards a reseller model: a customer-facing provider who pays for the generation capacity and fees to the network operators. This reseller is responsible for agglomerating all the costs of sourcing, coordination, and administration, and presents it to the customer. In some cases, the reseller (or “supplier”) may be part of a generating company and focus on selling their own electricity, and in other cases they have no generation activities at all.
Regardless of the actual supplier structure, however, the principle remains the same: all a consumer needs to know is the amount of kWh used over a period, and the unit cost for each kWh. The actual business of energy market trading, network operator interaction, regulatory compliance, and beyond is delegated away. For administrative and liquidity reasons, it is not possible to allow customers to do their own deals with generators and networks: the system mandates they must go through a supplier.
While this removes consumers from short-term variations in cost drivers like wholesale prices, it also strips them of agency and direct access to wholesale energy markets and energy networks. A classic principal-agent problem emerges: the supplier the consumer pays is supposed to act on their behalf, but the lack of information or decision-making ability on discrete decisions opens the chance for the supplier to extract additional value from the customer.
Financing for generation
Thermal power plants tend to become more efficient with each new generation, with the cost per MW of capacity declining over time. This is due to technological innovation allowing successive plants to tap ever-denser sources of energy, turn a greater share of their thermal energy into useful work, and discover economies of scale in construction.
This means that the cost per MW of new generation capacity tends to fall over time. However, this also means the fixed costs of new generation capacity – those which are frontloaded for the facility and capital stock itself – tend to grow, and take up a larger share of a power plant’s lifetime cost.
Paying for these fixed costs requires borrowing, which in turn requires creditors. Private creditors need a competitive investment and rate of return, which in modern times typically entails 6-10% annual interest on a bond to finance a larger power plant. (IAEA, 2006)
To illustrate the costs of such debt, we can imagine a theoretical 1,000MW power plant with fixed costs of £10bn. Assuming it was financed with a thirty-year bond, Table 1 illustrates the impact of rates on overall cost:
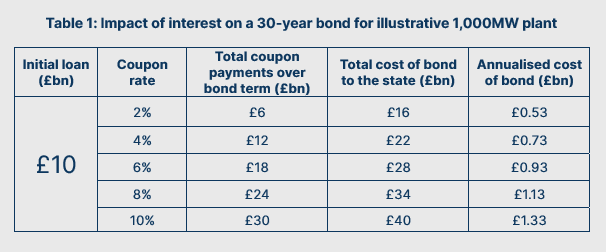
Table 1 shows that even at the lower coupon rate for private debt, these financing costs can more than double the fixed costs associated with a power plant. At the higher bound, the fixed cost can be triple. This represents a wealth transfer from bill-payers to a project’s creditors, since energy prices will need to cover the financing burden.
This contrasts with government bonds. Government bonds are the cheapest form of debt in a financial system, since they are considered the lowest risk asset available to investors. This makes them an ideal mechanism to finance new generation, especially when paired with the greater reserves enjoyed by governments that can allow them to choose shorter loan terms.
As shown in Table 1, a bond with a coupon rate of 2-4% – a typical range for UK government bonds between 2004 and 2024 – allows the financing costs of plants to fall significantly compared to private credit.
CAUSE 1:
ABANDONMENT OF PLANNING
Throughout the 20th century, some degree of planning – even in market economies like the US – was critical to energy affordability and security. Whether through complete state ownership of the energy sector or a public-private system based on state-issued contracts and permissions, planning infrastructure and long-term generation capacity was a central objective of governments.
Ten years after nationalising its own energy system, Britain finally arrived at its own long-term planning arrangement in 1957 with the formation of the Central Electricity Generating Board (CEGB). The CEGB was responsible for generation and national transmission, with publicly owned area electricity boards being responsible for maintaining regional distribution infrastructure.
The CEGB’s primary purpose was to guarantee availability, affordability, and reliability of energy supply. With this relatively technocratic mandate, it embarked on a programme of steadily increasing electricity supply to anticipate demand. Decentralised, and with modest time horizons of only five to seven years, the CEGB built supply and transmission infrastructure in anticipation of demand forecasts for the coming years. (Downing, 2025)
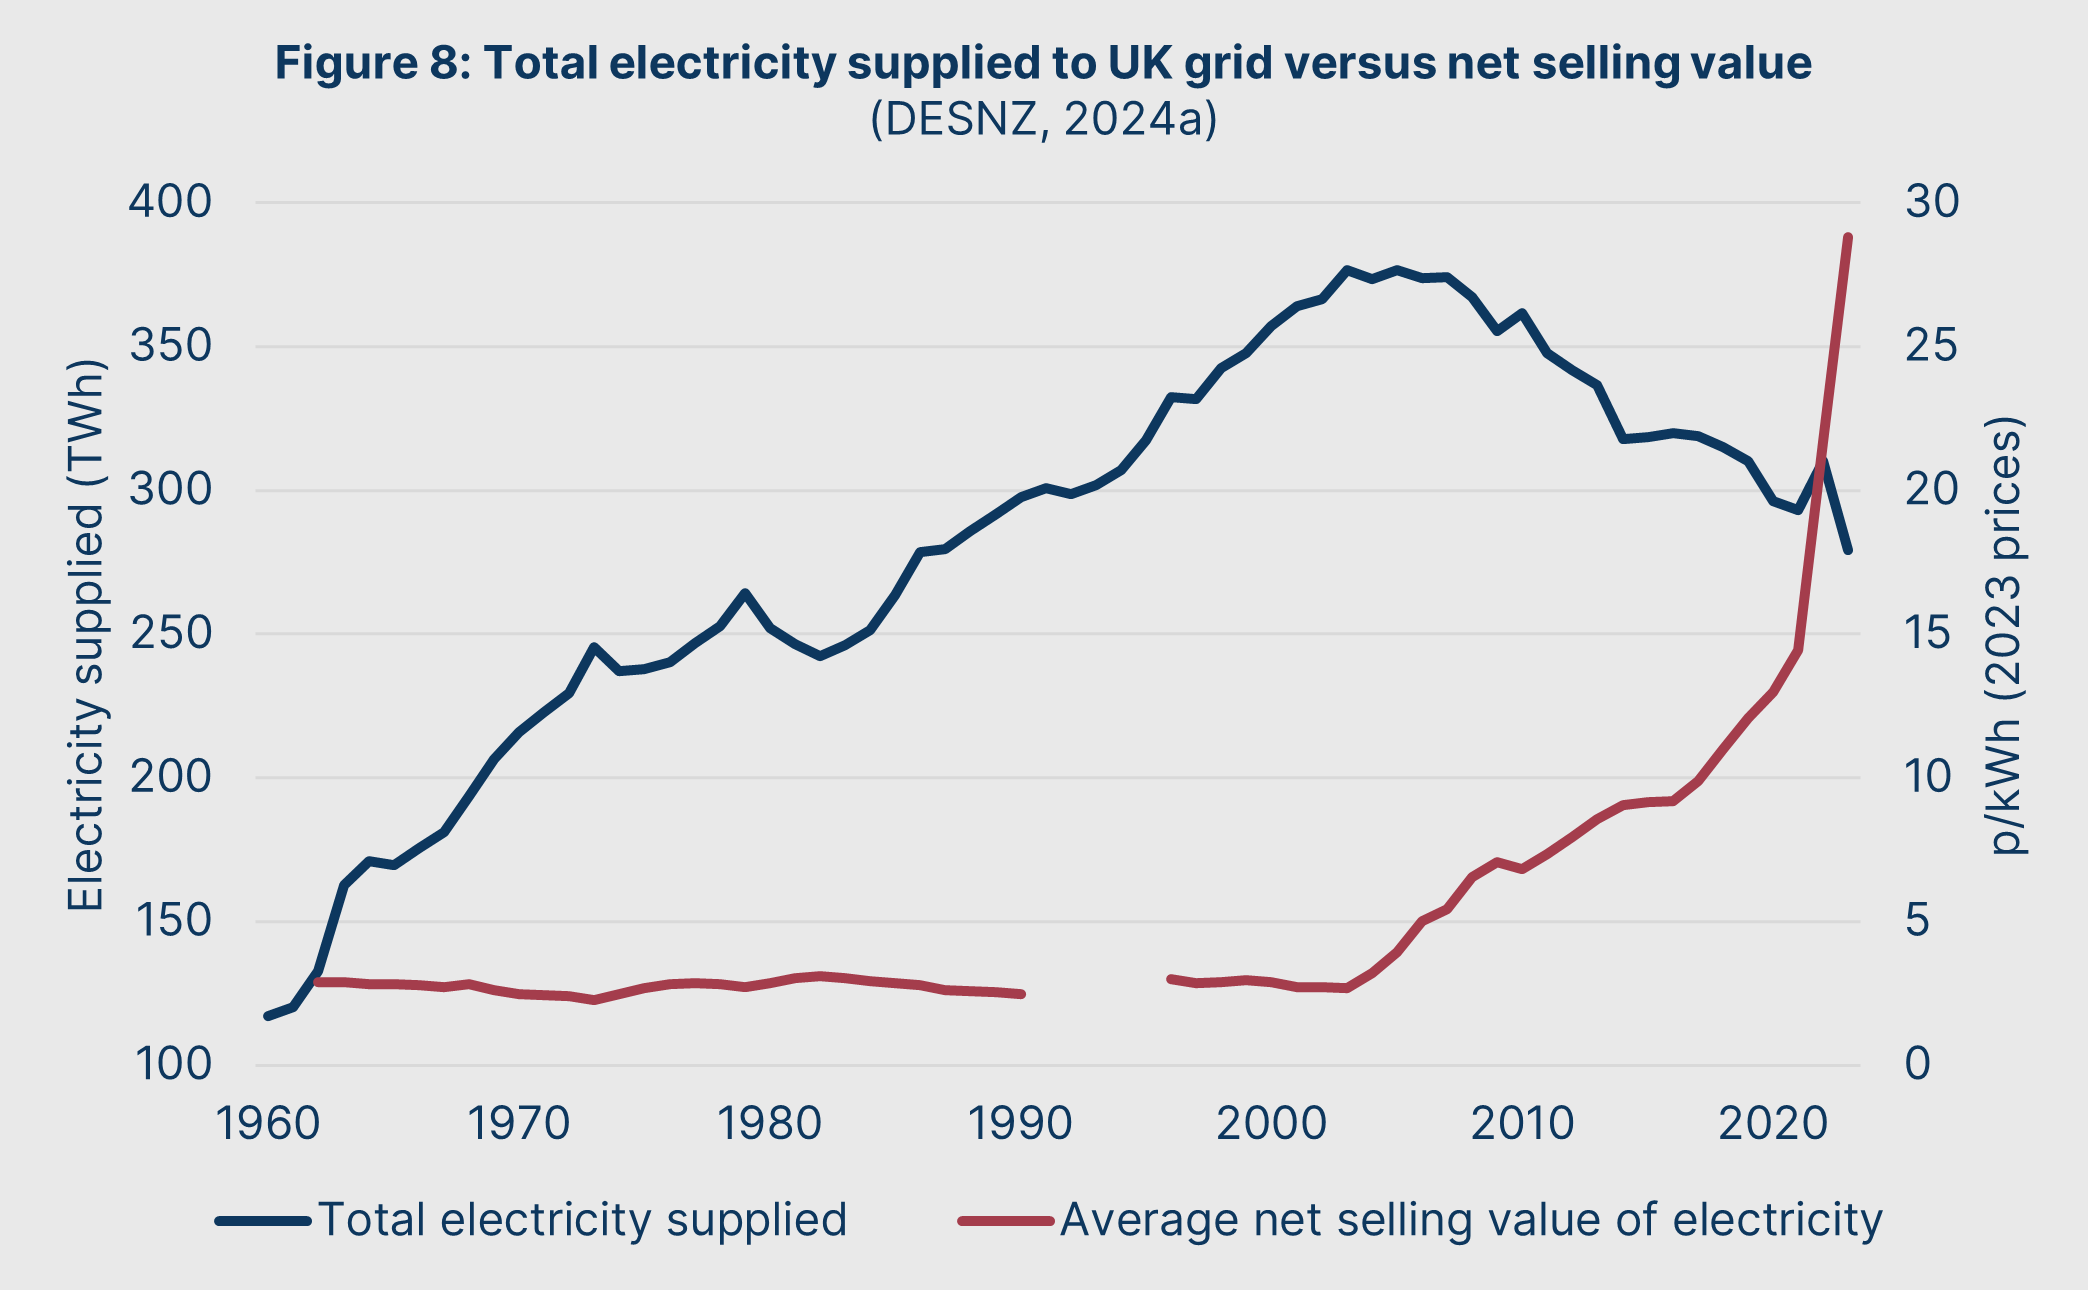
As shown in Figure 8, the CEGB’s approach increased total electricity supplied from ~120TWh in 1960 to ~300TWh in 1990 – an annualised growth rate of 3%. The result was a general decline in real electricity prices throughout the period, from 2.9p/kWh in 1960 to 2.5p/kWh in 1990. (DESNZ, 2024a)
However, in the 1970s, the CEGB became the target of ire for a new generation of radical economic thinkers. They believed a major structural cause of the period’s difficulties was Britain’s “mixed market” system: the coexistence of state-controlled sectors with private markets. These reformers believed that the CEGB’s entire methodology of expanding generation capacity based on forecast future demand was wasteful and flawed.
One of these reformers was Professor Stephen Littlechild of Birmingham University. In place of the CEGB, he argued that a market system based on real-time decision making and cost optimisation could deliver far better results for consumers and the country. (Littlechild & Vaidya, 1982)
The efforts of these reformers bore fruit in the form of the Energy Act of 1989, which mandated the breakup of the CEGB and privatisation of the entire energy system. This new market would be overseen by the new regulator led by a Director General of Electricity Supply: Stephen Littlechild.
Littlechild was a sincere believer in the power of the profit motive at discovering efficiencies and cost reductions. In his view, once freed from political control, the energy system would dramatically improve by reducing the amount of capital tied up in underutilised infrastructure. Unfortunately, he was wrong.
The centrality of energy to economic activity meant that, in practice, it could not be decoupled from political considerations. The idea that drives for cost optimisation would improve innovation and investment bore no fruit. And, without forward planning, investment in infrastructure and generation became solely contingent on the quarter-to-quarter or year-to-year financial interests of the new energy companies.
Even when the new market players did invest, it was not necessarily in the interest of the whole energy system. As the last of the CEGB’s investments – such as the Sizewell B nuclear power station – came online in the mid-1990s, the newly privatised energy industry was investing in its first power plants via the so-called “dash for gas”.
However, as explored in Discussion 2, the dash for gas ended up merely creating surplus capacity and prematurely shutting down many thermal plants with decades of remaining operational life. This market failure was just one sign of things to come. Despite Littlechild’s beliefs, the profit motive was not aligned with the strategic considerations that are unique to the energy system.
At the conclusion of the dash for gas, the total electricity supplied reached its peak.
A necessary condition for this was almost certainly the abandonment of planning. It is worth emphasising that planning is not necessarily at odds with privatisation. Influential economists such as Helm (2019) have proposed a “system operator model” – one where the state creates a long-term capacity plan, which it then uses to instruct private generators, networks, and suppliers to deliver.
Instead, however, Littlechild’s entire project was predicated on the abandonment of planning in favour of incentives and market forces. It was this decision, first and foremost, that set the stage for the crisis that was to come.
DISCUSSION 2:
THE POISONED CHALICE OF THE “DASH FOR GAS”
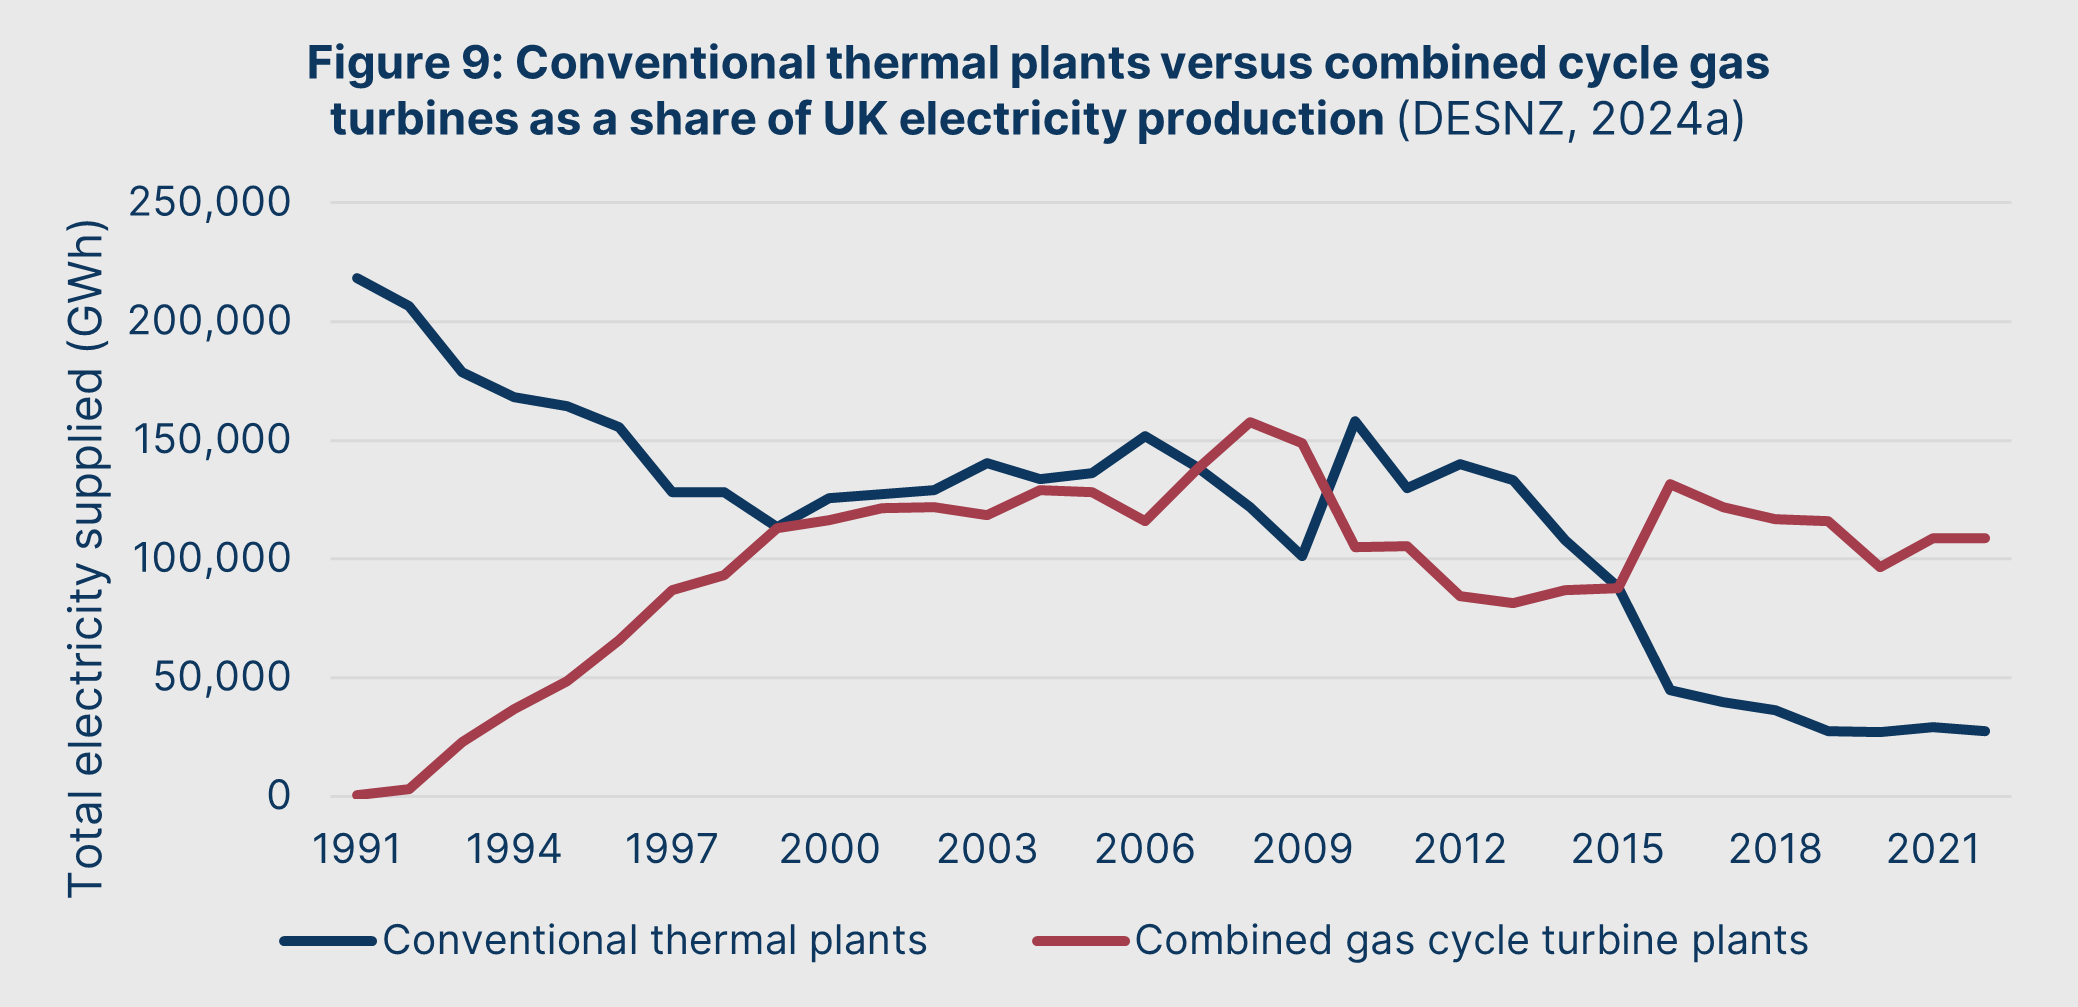
The dash for gas of the 1990s and early 2000s saw rapid construction of combined cycle gas turbine power plants. Along with exploiting North Sea natural gas, these plants also benefited from lower operational and labour costs. Best of all, they could be built extremely quickly – all the plants came online within 2-3 years of construction starting.
The pace of this transition happened without regard for the viability of many of Britain’s existing thermal power plants – namely, coal and oil plants. Many of these plants had decades of useful life remaining. Instead of their gradual replacement by gas plants as coal and oil plants were retired, the capacity was written off prematurely and a rapid contraction in coal and oil power resulted, as shown in the date range 1990-2000 in Figure 9.
The result of this abrupt transition was twofold. First, it irrevocably accelerated the decline of Britain’s remaining coal mining industry through a sudden contraction in demand. In 1992, just two years after privatisation, it was announced that 31 out of the remaining 50 deep mines would be closed. (BBC, 1992)
Along with the human damage that came with one of the largest redundancy waves in British industrial history, the coal pit closures also undermined long-term energy security. The coal industry had doubled its productivity in the previous six years, a trend that had every indication of continuing through a 10-20 year transition period to gas by means of the gradual running down coal plants. If it had been allowed this time, these productivity gains could have enabled British coal to live on as a major export – or as a feedstock for a new generation of cheap coal power generation.
Second, this transition meant the largest contribution to hydrocarbon-based electricity generation became heavily concentrated in the gas plants built during the 1990s. This concentration becomes a significant risk for grid stability, since this requires all plants to be replaced in a much shorter time period.
This is particularly problematic as gas plants have a noticeably shorter lifespan than coal plants: the upper bound for coal plant operating periods is 45 years, whereas the upper bound for CCGTs is 35 years. (Parsons Brinckerhoff, 2011)
Some 23 out of Britain’s 35 gas-fired power stations were commissioned between 1992 and 2000, which means they were intended for replacement between 2027 and 2035. (DESNZ, 2024a) These plants are critical for grid stability. But, as of the time of this Green Paper, no new CCGT plants have broken ground to replace this capacity. The ultimate legacy of the dash for gas may be an existential risk for Britain’s energy system.
CAUSE 2:
A FLAWED PRIVATISATION
Along with abandoning planning, Littlechild’s new energy system baked in many perverse incentives.
Most members of the public intuitively know that electricity provision tends to be monopolistic. However, as mentioned in Discussion 1, the truly monopolistic part of the energy system is to be found in transmission and distribution.
Littlechild’s chief innovation was a new system of regulations and price controls for monopolies, which allowed them to offer competitive prices while still encouraging efficiencies and investments. Once applied to transmitters and generators, it was envisioned that these regulations would create a truly competitive energy market. The vision was one where consumers could “vote with their feet” and choose the most affordable suppliers, who in turn would vote with their own feet in the generation market.
At the heart of this new system was a price cap set by the regulator. Between 1990 and 2013, this was in the form of an “RPI-X” system: prices could rise no faster than RPI minus a projected efficiency gain (X) for a five-year period. This was supposed to deliver continuous price improvements while still giving the operator an incentive to discover efficiencies. If the operator was able to outperform the X-factor, then it could keep the surplus savings as profit. (Energy and Climate Change Committee, 2015)
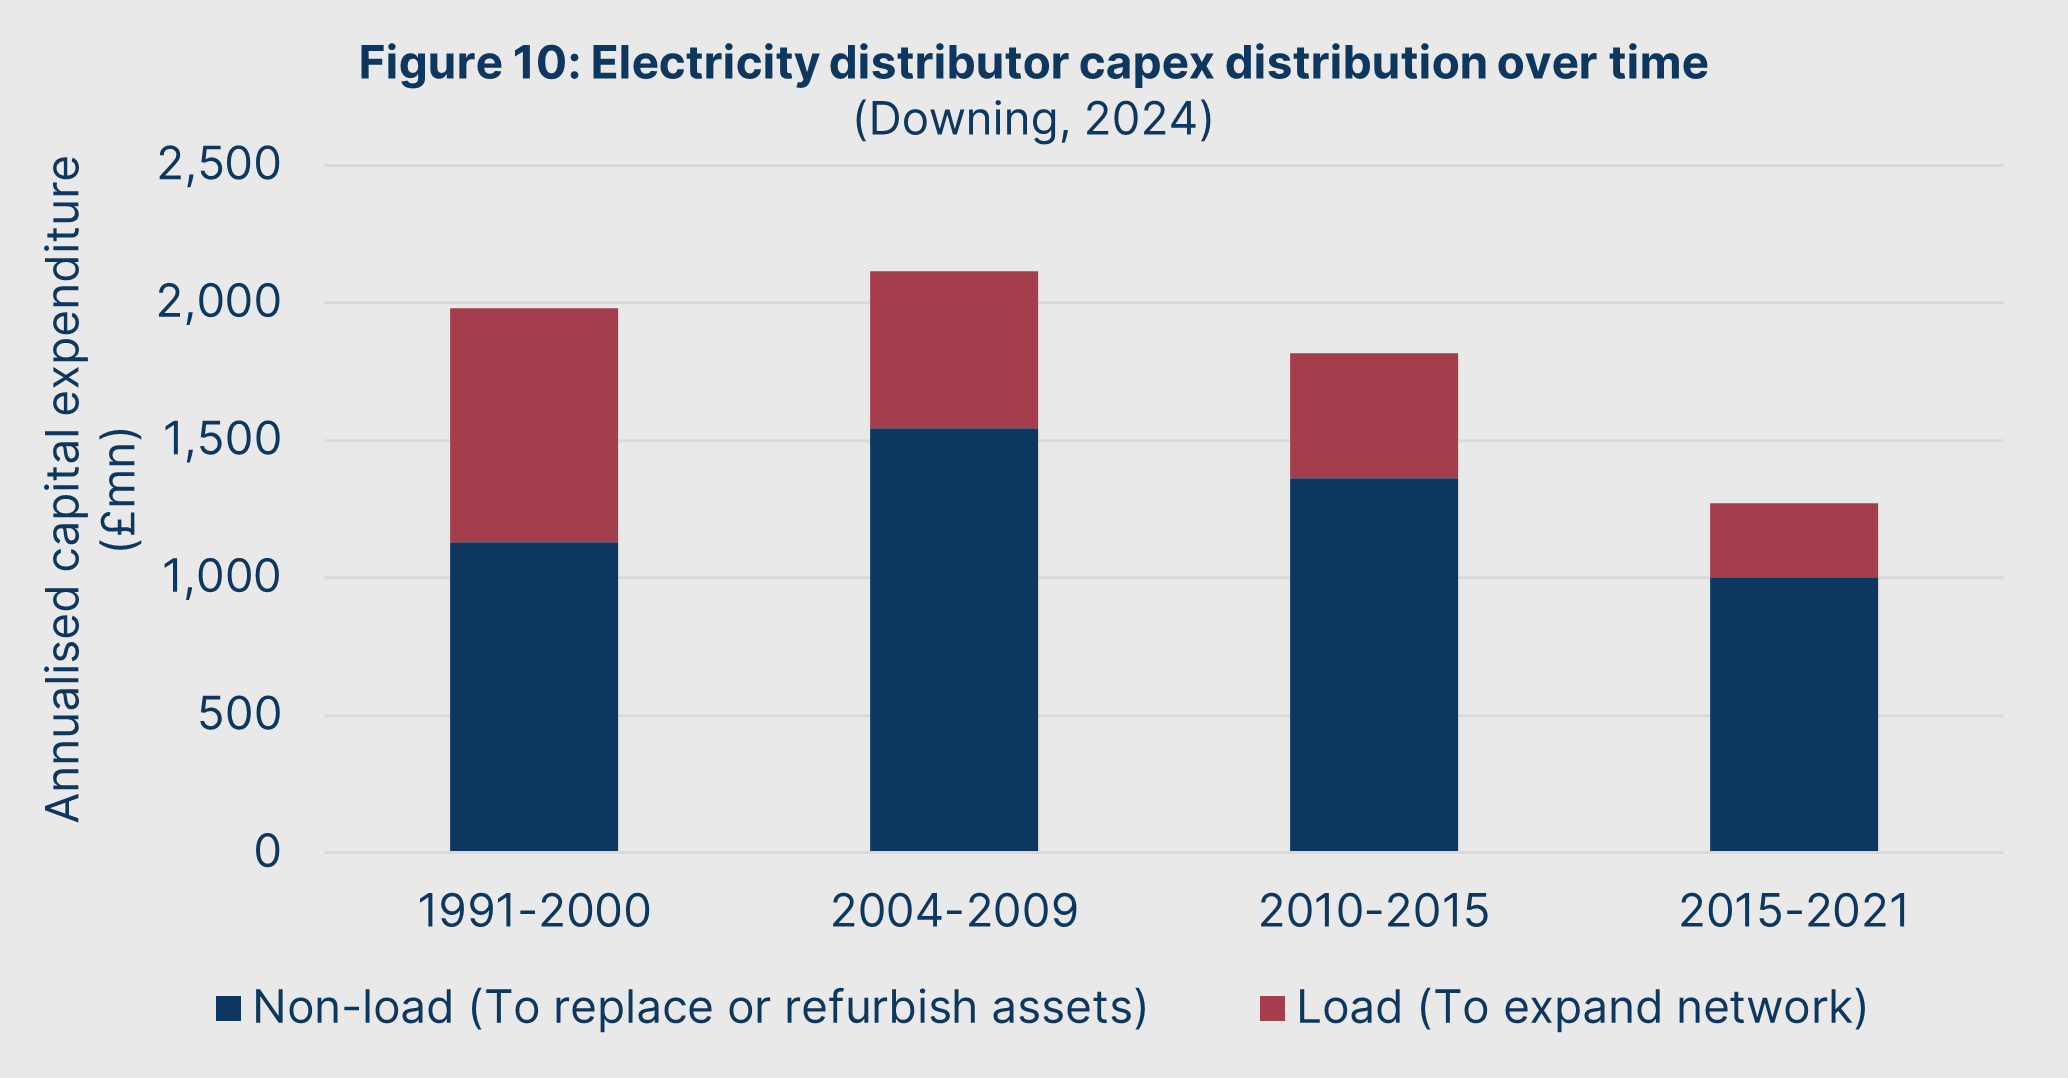
However, this X-factor solely considered efficiencies – cost savings – and did not consider the rate of return on investments. It thus baked in an incentive to under-invest in new infrastructure, extend ageing infrastructure beyond its serviceable life, and reduce maintenance costs. It also gave rise to a “just in time” mentality and discouraged pre-building network infrastructure until need was certain.
As shown in Figure 10, capital investment by distributors has steadily declined in the decades following privatisation.
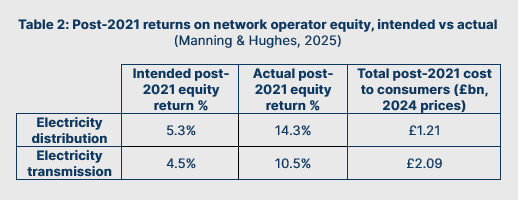
Along with running down infrastructure, those responsible for distribution and transmission networks also have leveraged the fact that Ofgem (and previously OFFER) have consistently overestimated the price cap period’s interest rates. This has opened an opportunity for networks: they are effectively given an extra allowance for cheap borrowing to fund share buybacks and bonus schemes. This is illustrated in Table 2.
A case in point is National Grid. In 1998, National Grid Group’s debt-to-equity ratio was 24%. By 2022, National Grid Electricity Transmission’s debt-to-equity ratio was 53%. Since privatisation, the typical debt-to-equity ratio of network companies has shot up into the range of 50-60%. (Downing, 2024)
The shortcomings of the privatised system, however, were not limited to the energy networks. After prematurely destroying much of Britain’s coal supply chain and replacing it in the dash for gas, the market has since largely failed to finance new thermal or gas capacity to replace the winding down of the remaining coal and oil plants.
The envisioned competitive supplier system inevitably devolved into a “Big Six” oligopoly that failed to bring down customer bills. In 2019, Ofgem finally conceded that market forces had failed. Now, the entire energy system would be subject to price controls – not just the monopolistic parts. They instituted a price cap on retail energy bills.
Every quarter, Ofgem would now review the costs facing suppliers – including wholesale, network, operational expenses, and policy compliance costs – and add a small margin for profitability. The idea that suppliers could discover prices through competition was dead, and in practice the price cap became the price most consumers paid.
But even since this price cap was introduced, prices have continued to rise at an alarming rate. These price rises have not been driven by wholesale costs, aside from three supply shocks in 2008, 2021, and 2022. Instead, retail prices have risen because of a continuous increase in non-wholesale costs. This is illustrated in Figure 11.
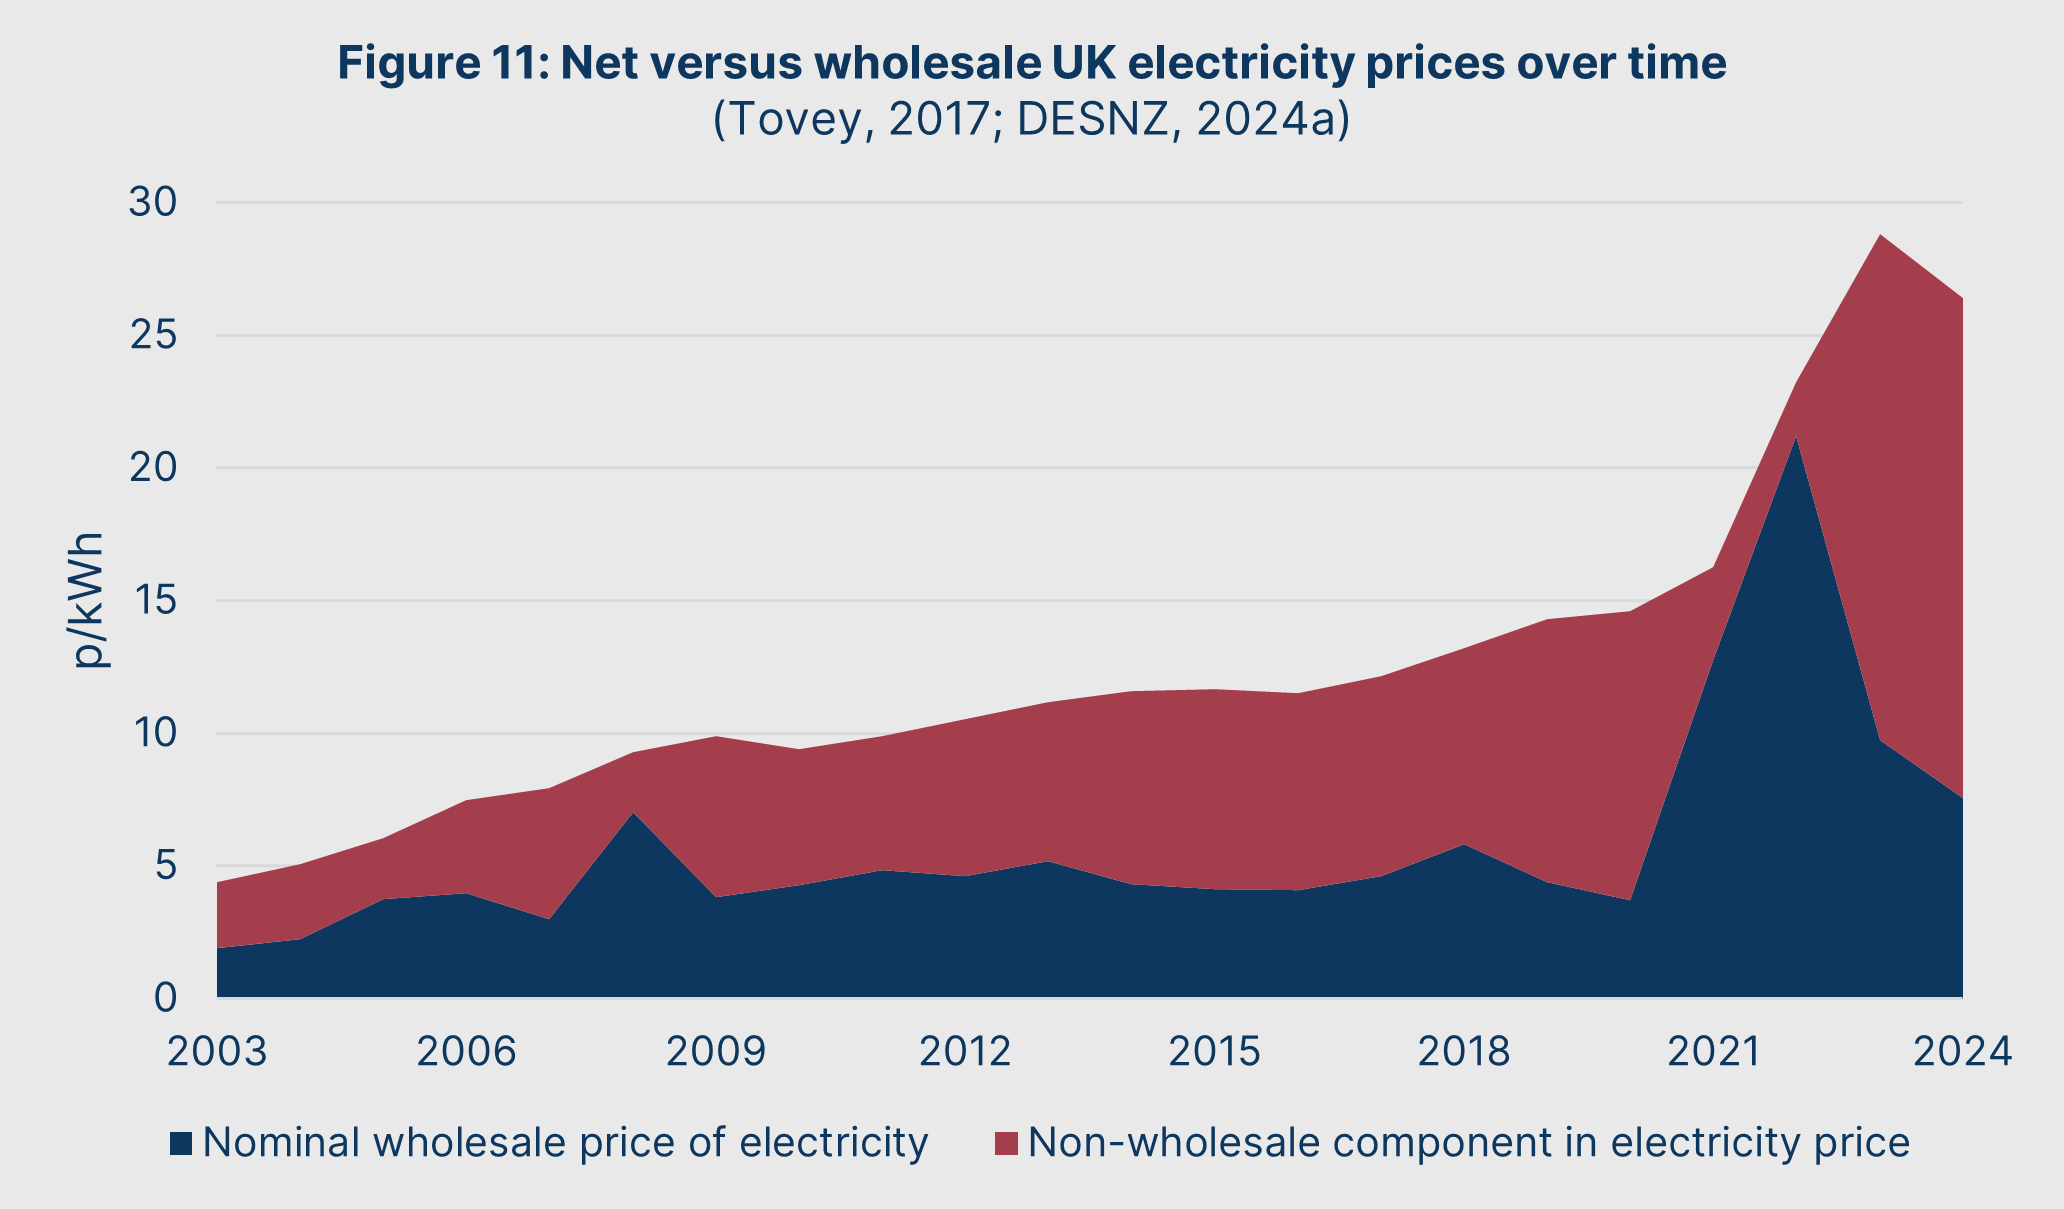
Comparing 2004 and 2024, 77.6% of the nominal change in net energy prices is due to non-wholesale price increases. The rise in these non-wholesale costs cannot be explained by supplier behaviour. Instead, we must turn to the final and most destructive element of the energy crisis.
CAUSE 3:
THE RISE OF RENEWABLES
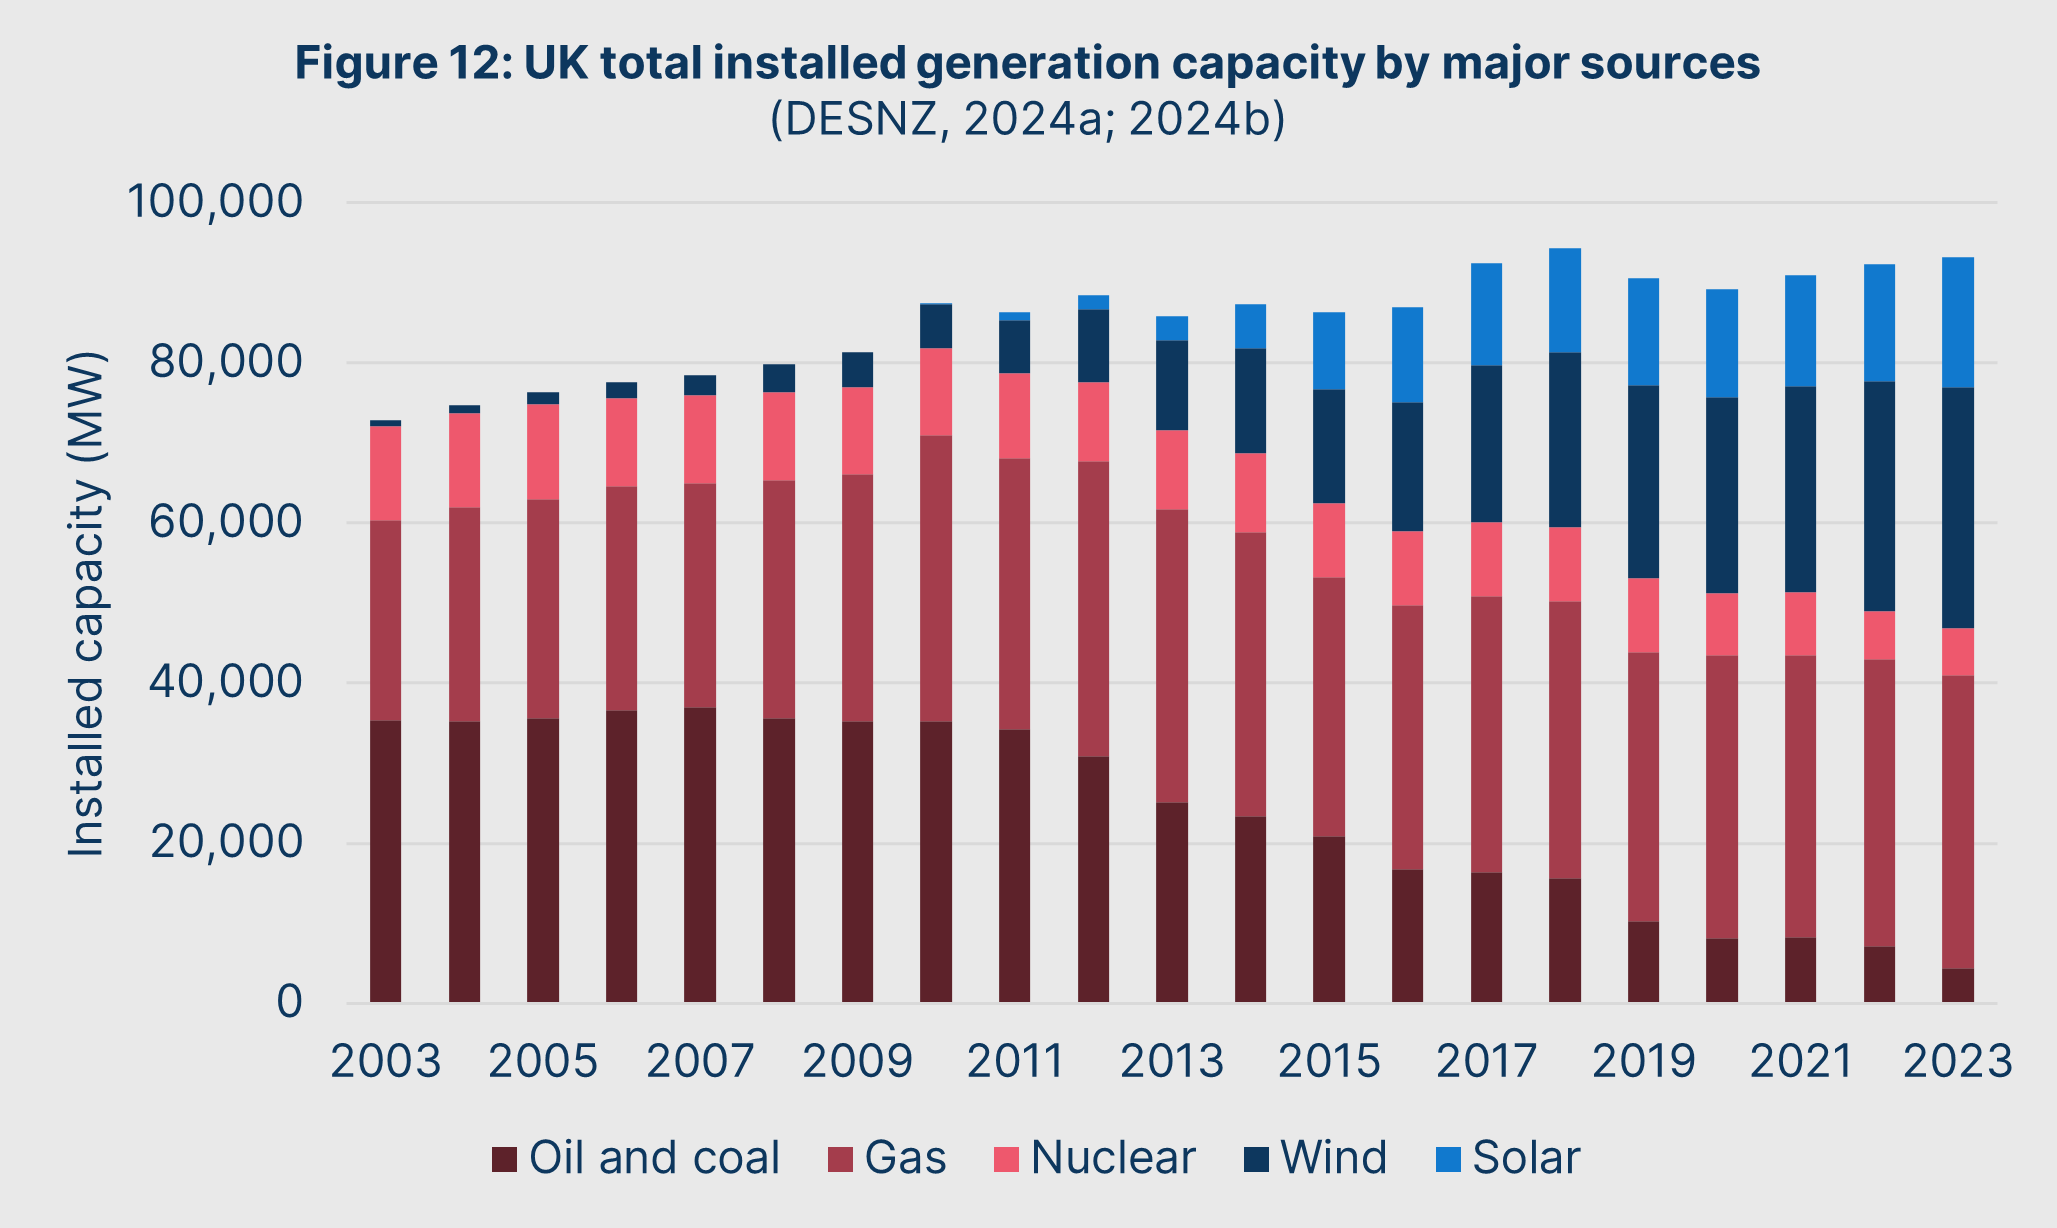
From the start of this Green Paper, we have noted that total electricity supplied to customers and industry has declined since 2005. Despite this, however, the total installed generation capacity of Britain has increased: from 78GW in 2003 to 106GW in 2023.
Figure 12 provides the explanation for this apparent contradiction: our generation mix.
In 2003, 92.3% of Britain’s installed capacity was oil, coal, gas, or nuclear. In 2023, it was just 44.3%. In the same period, two new generation sources have risen from near-nonexistence to nearly half of installed capacity: wind and solar.
To understand the importance of this change in the generation mix, we must explore two concepts: power density and capacity factors.
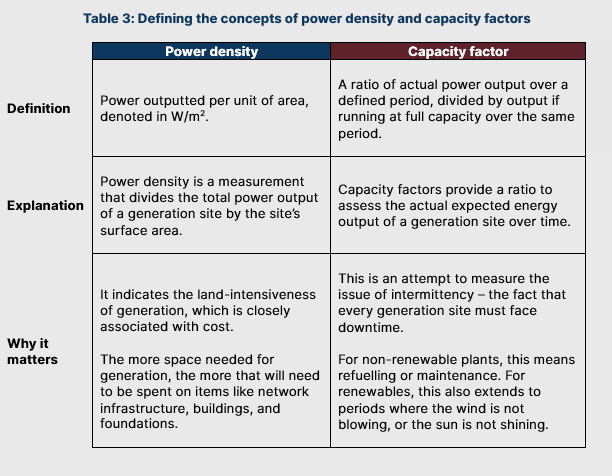
These two concepts offer us a way to measure how resource-intensive, productive, and reliable a given MW of installed capacity is. They also help explain the fundamental problems confronting wind and solar generation at scale.
Firstly, a review of power density shows that wind and solar have a significantly lower power density than the current main non-renewable component in the energy system, which is natural gas. This is shown in Figure 13.
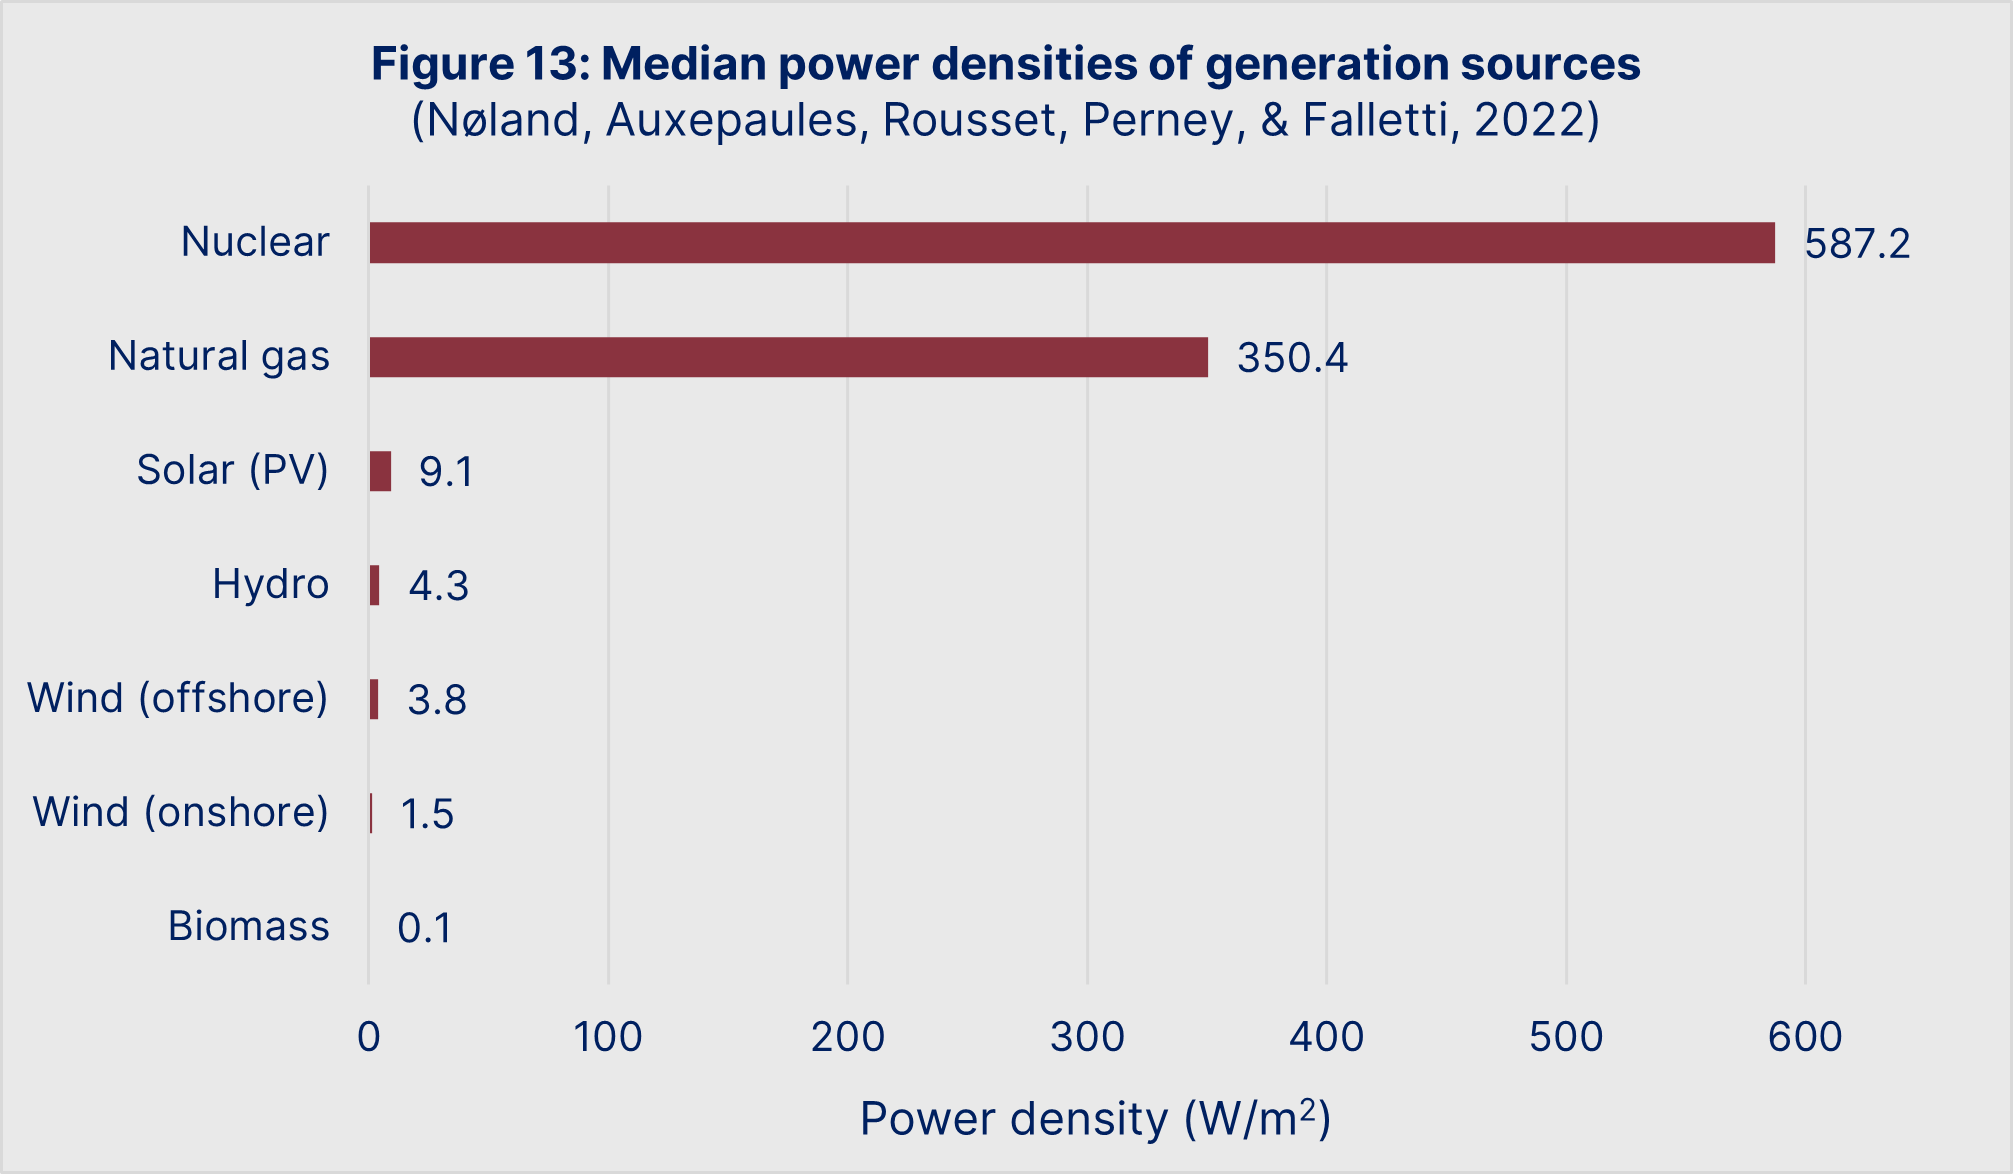
Power density means a dramatic increase in the amount of land and resources required to construct capacity. For example, to match the output of an equivalent natural gas plant:
- Solar will require ~40x more land
- Offshore wind will require ~90x more land
- Onshore wind will require ~230x more land.
This extra land needs to be purchased or leased, which is a cost driver in of itself. But preparing this land creates yet more costs: the ground must be levelled and provided with drainage for solar farms, and foundations need to be set for wind farms.
Power density also means that more raw materials will be needed per equivalent unit of installed capacity. This comes in the form of constructing the generation equipment such as turbines and solar panels, along with the necessary infrastructure – such as cabling, collection stations, and networking systems – to coordinate output among the individual generating units.
Along with needing more land and capital per unit of installed capacity, wind and solar also suffer from a significantly lower capacity factor compared to other generation sources. Figure 14 lists the capacity factors for various power generation sources, and shows that intermittent renewables significantly underperform.
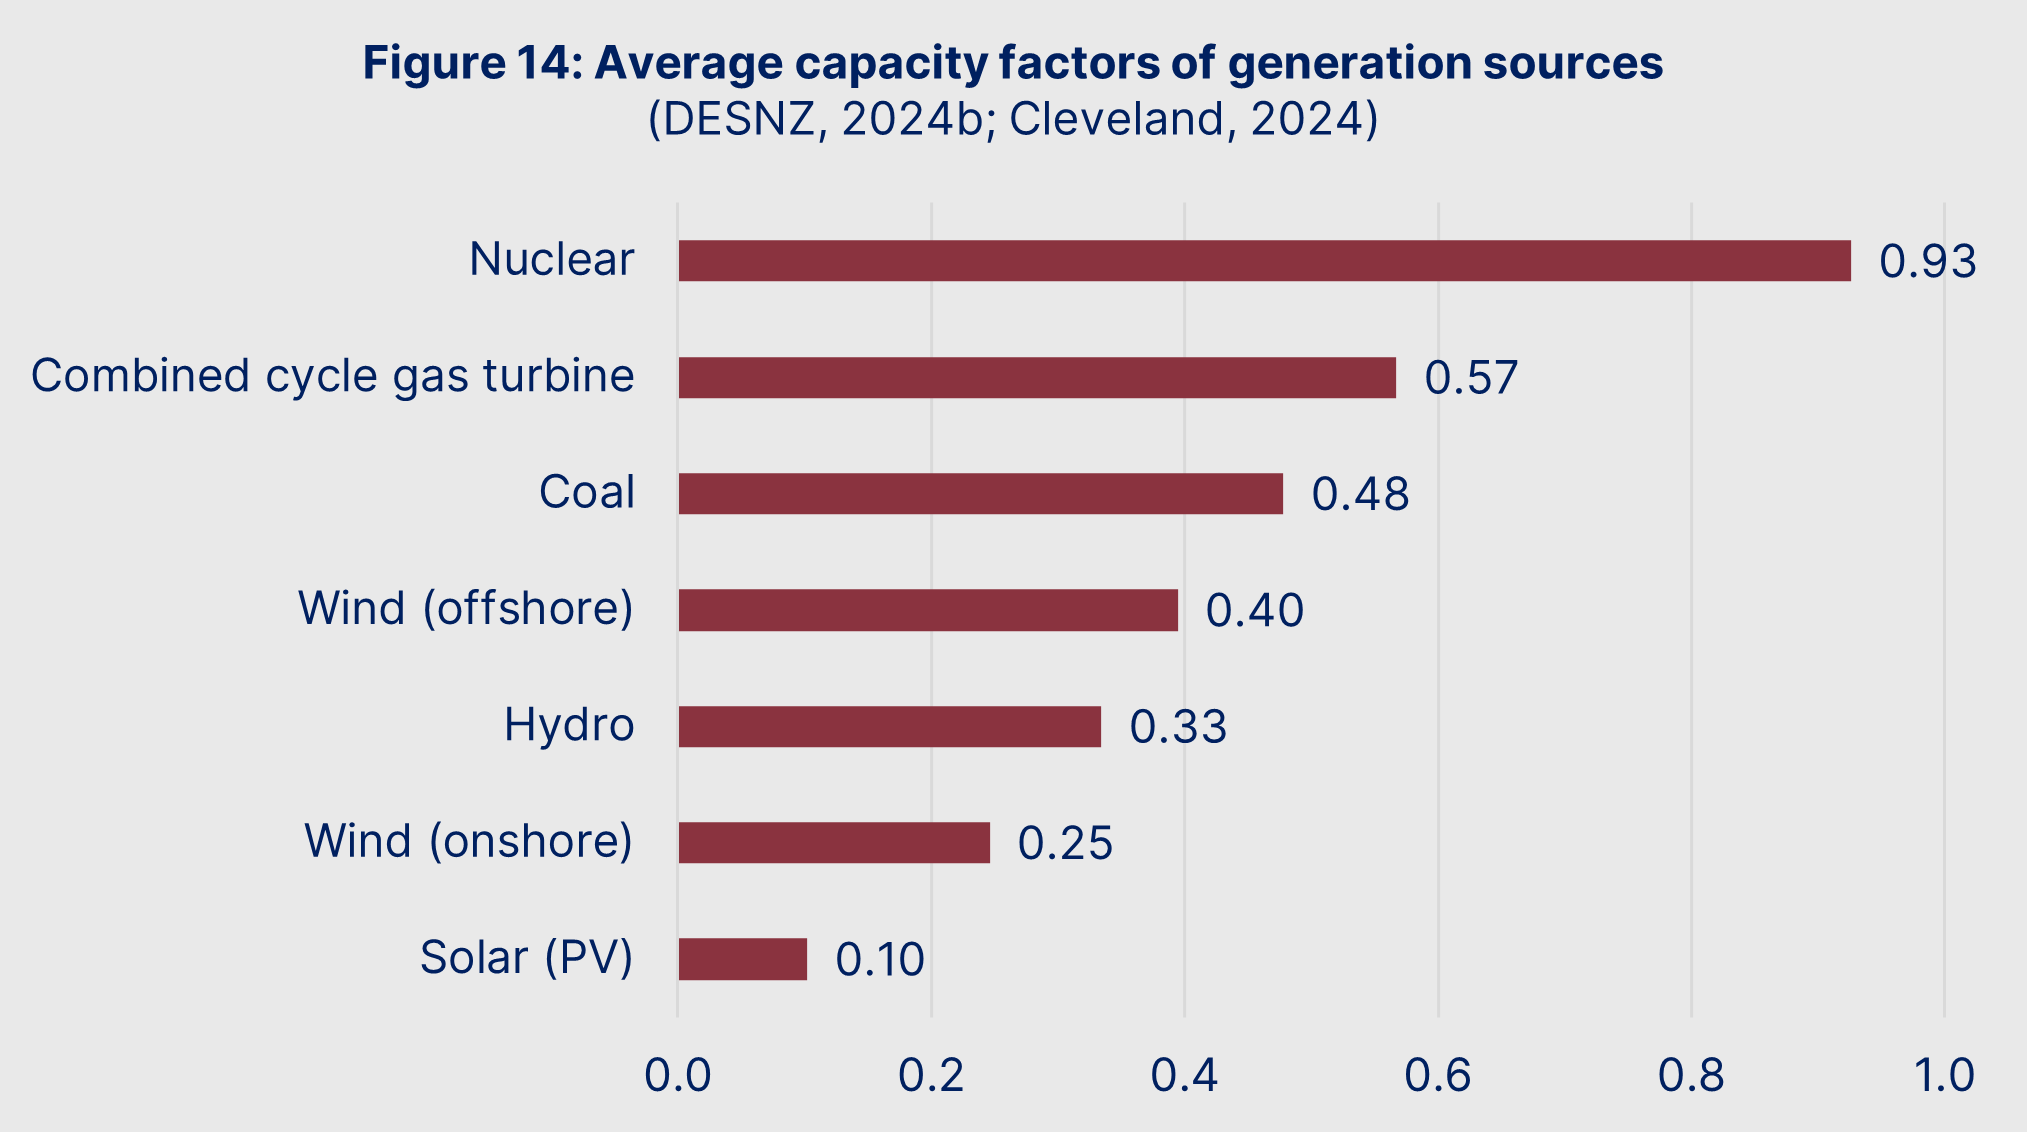
However, merely analysing the “raw” capacity factor can prove misleading. This is because the nature of the capacity factor differs markedly between renewable and non-renewable sources.
For non-renewable sources, capacity factors are a function of refuelling, maintenance, and repair requirements. Aside from accidents, humans remain in control of when the plant operates. This means we can synchronise plant operations and supply to “cover” for those that are offline.
In other words, the capacity factor for traditional generation is simply the utilisation rate of individual plants. Because individual plant utilisation can be planned and synchronised, the capacity factor does not constrain aggregate generation.
By contrast, capacity factors of intermittent renewables reflect things that are beyond human control such as the length of the day and night cycle, wind speeds, and cloud cover. The capacity factor determines the utilisation rate of the entire fleet of renewables, and thus constrains aggregate generation. To try to account for this, energy providers and government departments can “de-rate” installed capacity to determine averaged output throughout the grid. The de-rated generation split over time is shown in Figure 15.
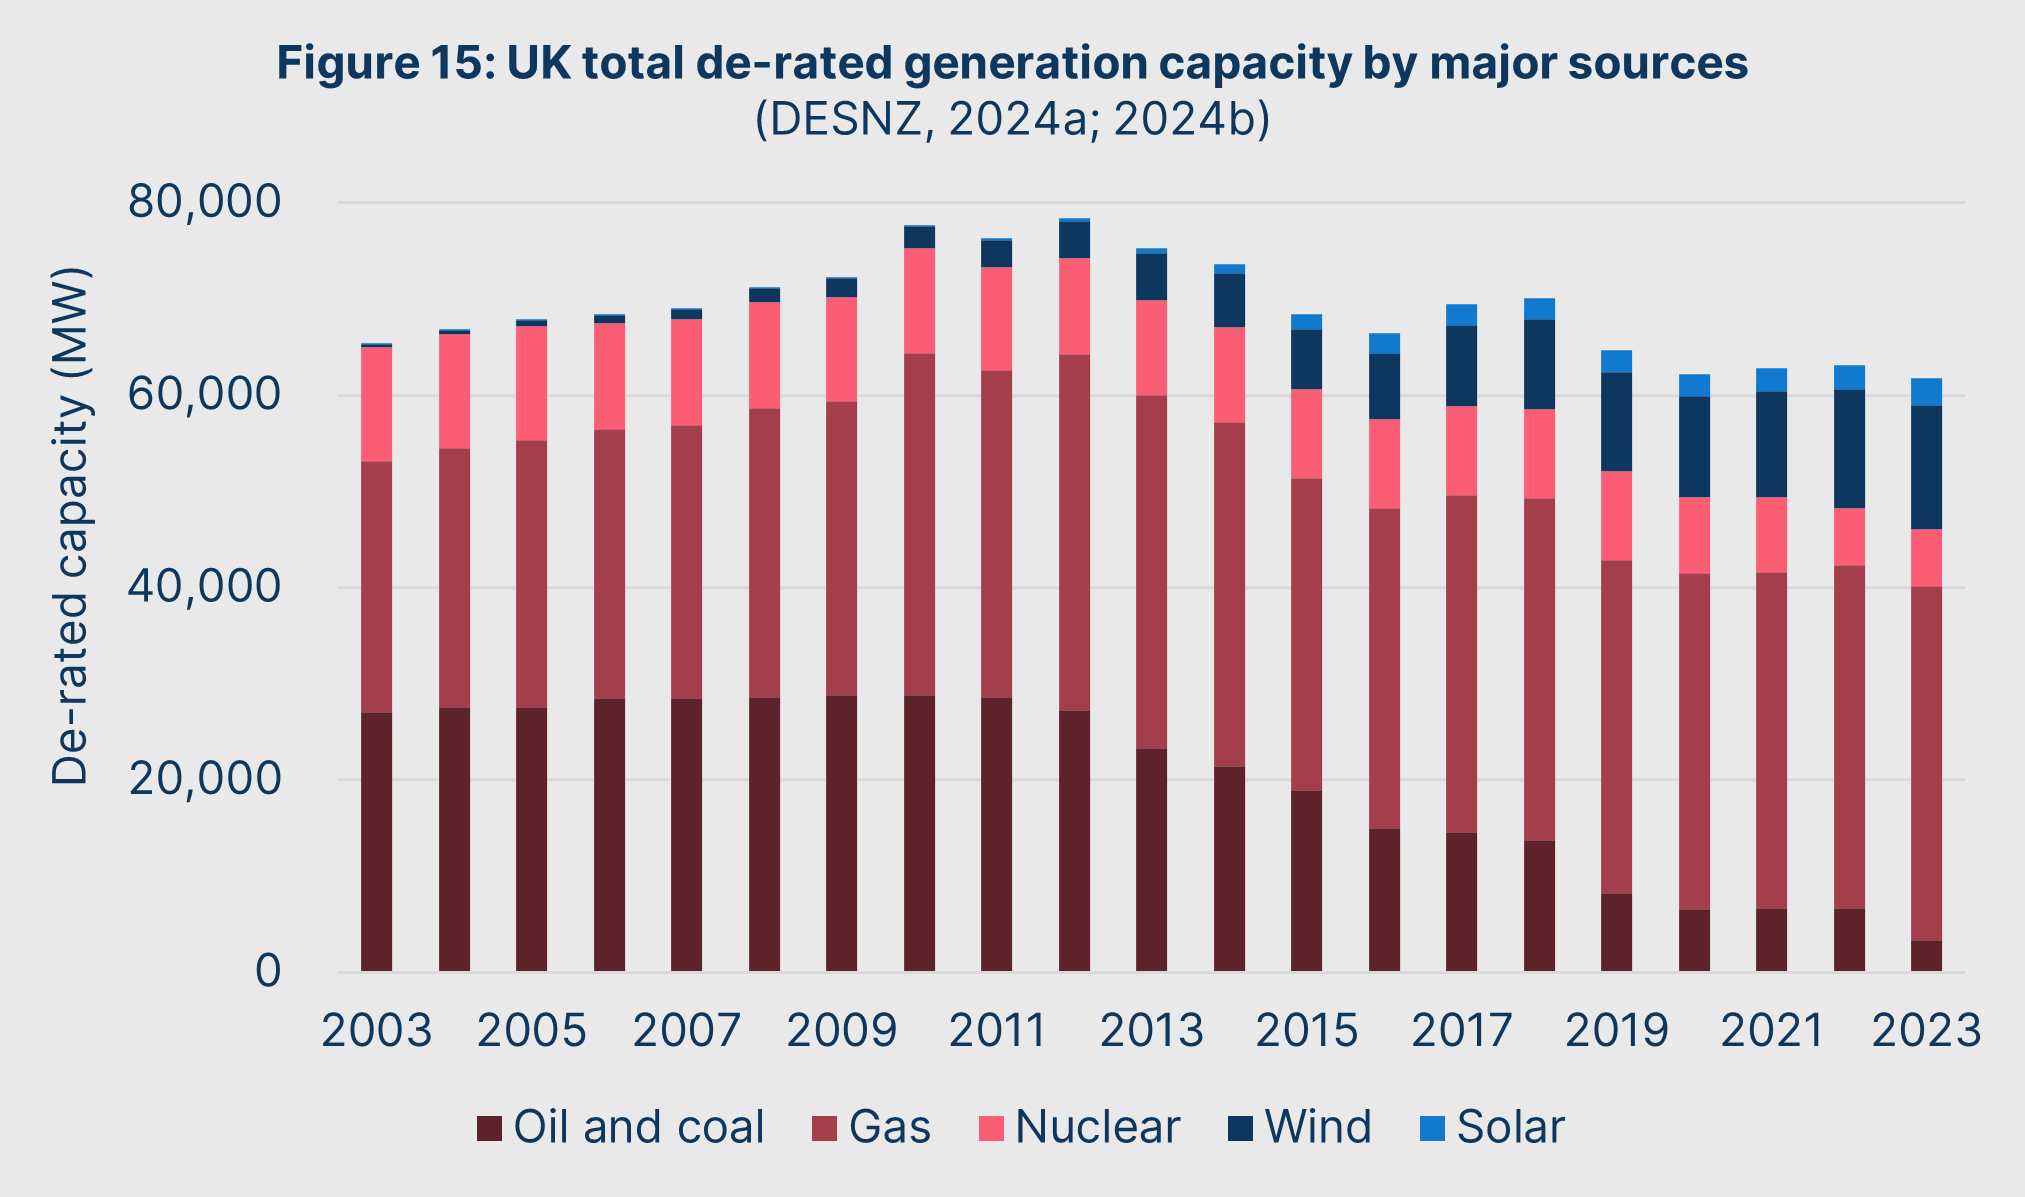
(Wind, hydro, and solar all use DESNZ capacity factors, reflecting geographic constraints such as our latitude for solar power. For nuclear, gas, and coal generation, US capacity factors have been used.)
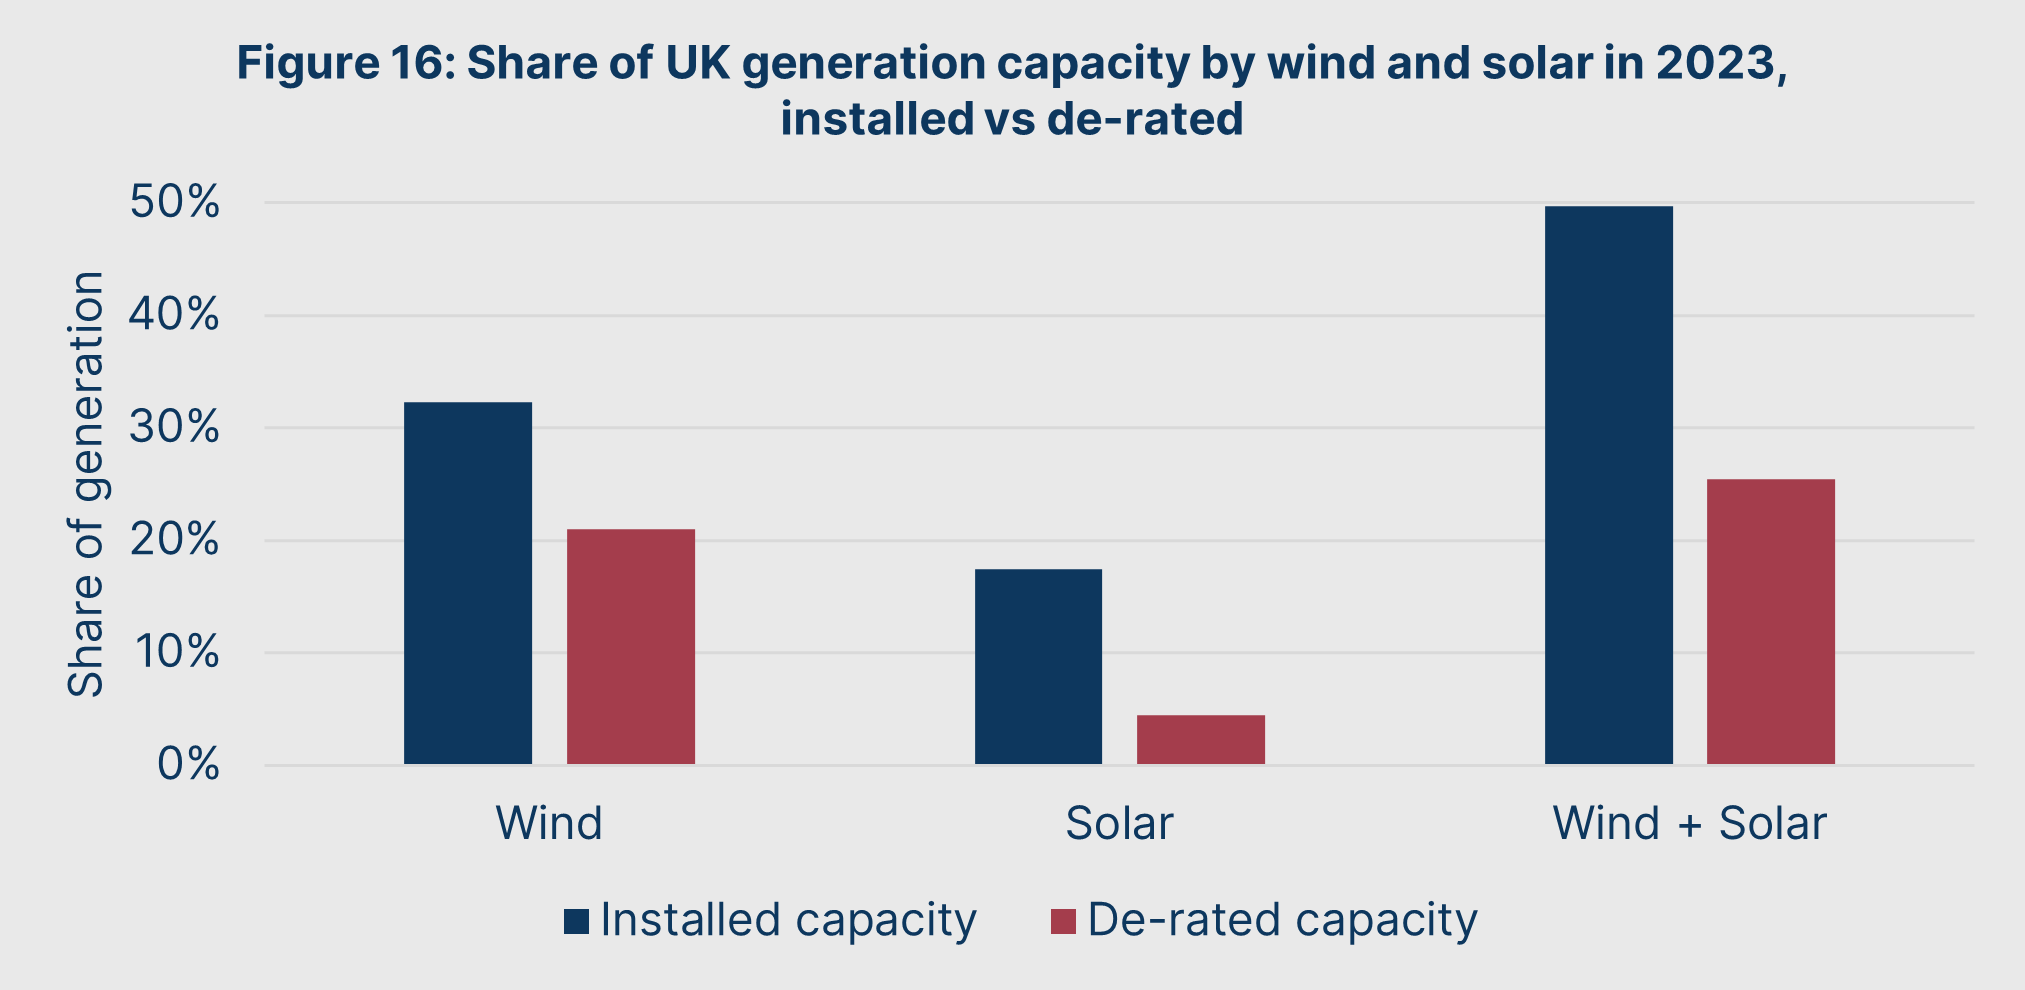
To try to account for this, energy providers and government departments can “de-rate” installed capacity to determine averaged output throughout the grid. The de-rated generation split is shown in Figure 16. After de-rating, wind and solar shrink markedly in terms of their possible contribution to the grid – wind from 30GW to just 13GW, and solar from 16GW to 2.8GW. This can be seen by comparing their share of generation capacity in 2023.
There is a method that purports to account for lower power densities and low capacity factors: a metric called the levelized cost of electricity. As a concept, it can be defined as:

On the face of it, LCOE analysis allows us to discover how much renewable energy costs after accounting for the challenges of space, high fixed costs, and intermittency. The Department for Energy Security and Net Zero (2023) estimates the LCOE of offshore wind and solar commissioned in 2025 stands at 5.3p and 4.9p per kWh respectively.
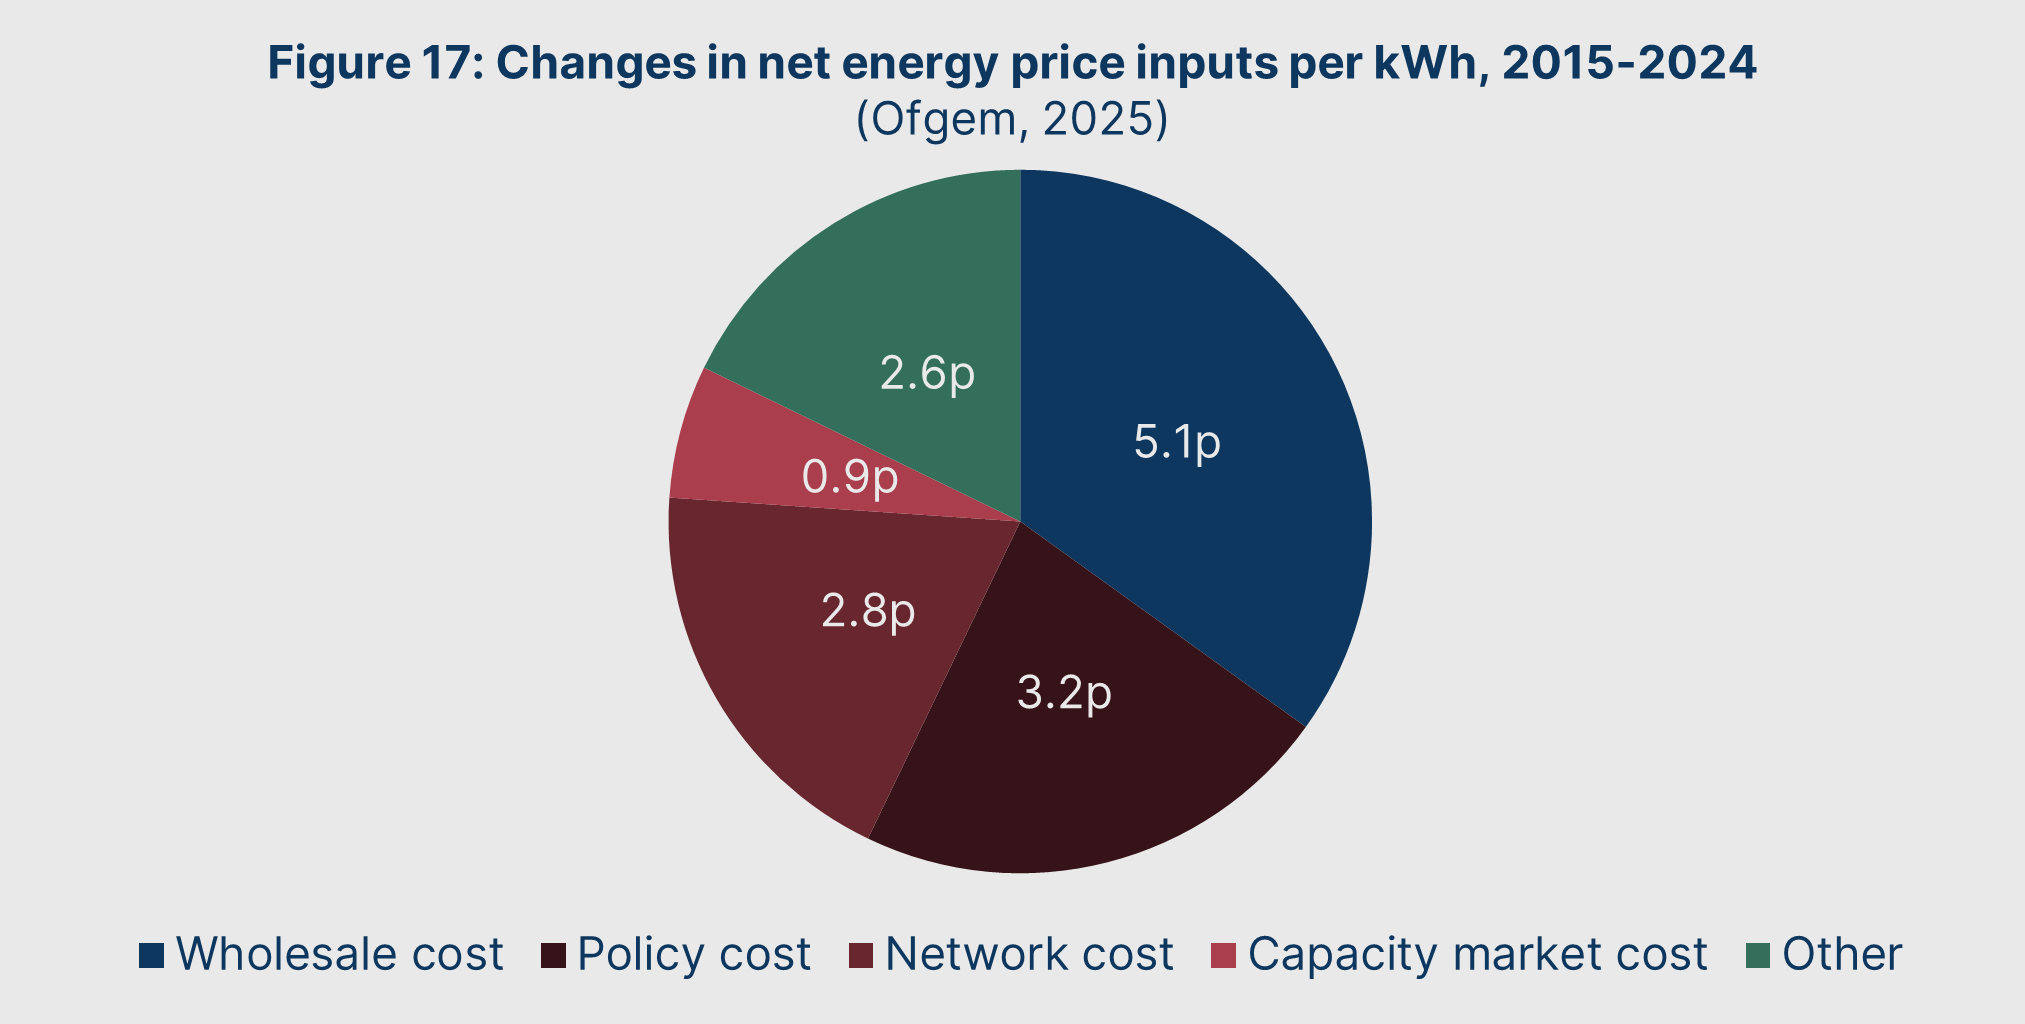
However these nominally low LCOEs are deceptive. This is because, as shown in Figure 17, the main drivers of energy price growth in recent years have not in fact been wholesale costs. Instead, price growth is mostly due to rising policy costs, network costs, and capacity market mechanisms (wherein generation capacity is held idle for use in supply shortfalls).
DISCUSSION 3:
THE THROTTLING OF OIL AND GAS
Since the early 2000s, governments have pursued two policies to reduce Britain’s consumption of oil and gas: carbon pricing, and supply-side restrictions.
Beginning with carbon prices, there are two concurrent carbon pricing schemes that influence wholesale prices. First, there is the Carbon Price Support (CPS), which is a flat tax on every tonne of carbon dioxide produced. Second, there is the Emissions Trading Scheme (ETS), which is an internal market for emissions allowances. These allowances can be purchased at auction or on a secondary market.
Turver (2025) estimates that, as of 2025, these two carbon pricing schemes add 1.5p/kWh to the price of gas-produced electricity. With a unit price of 7.5p/kWh, this means that 20% of the cost of gas-powered electricity can be attributable to carbon costs.
However, even if we were to subtract these carbon costs, we would still be left with a relatively high pre-carbon tax wholesale price of 6p/kWh. This can be explained through supply-side restrictions.
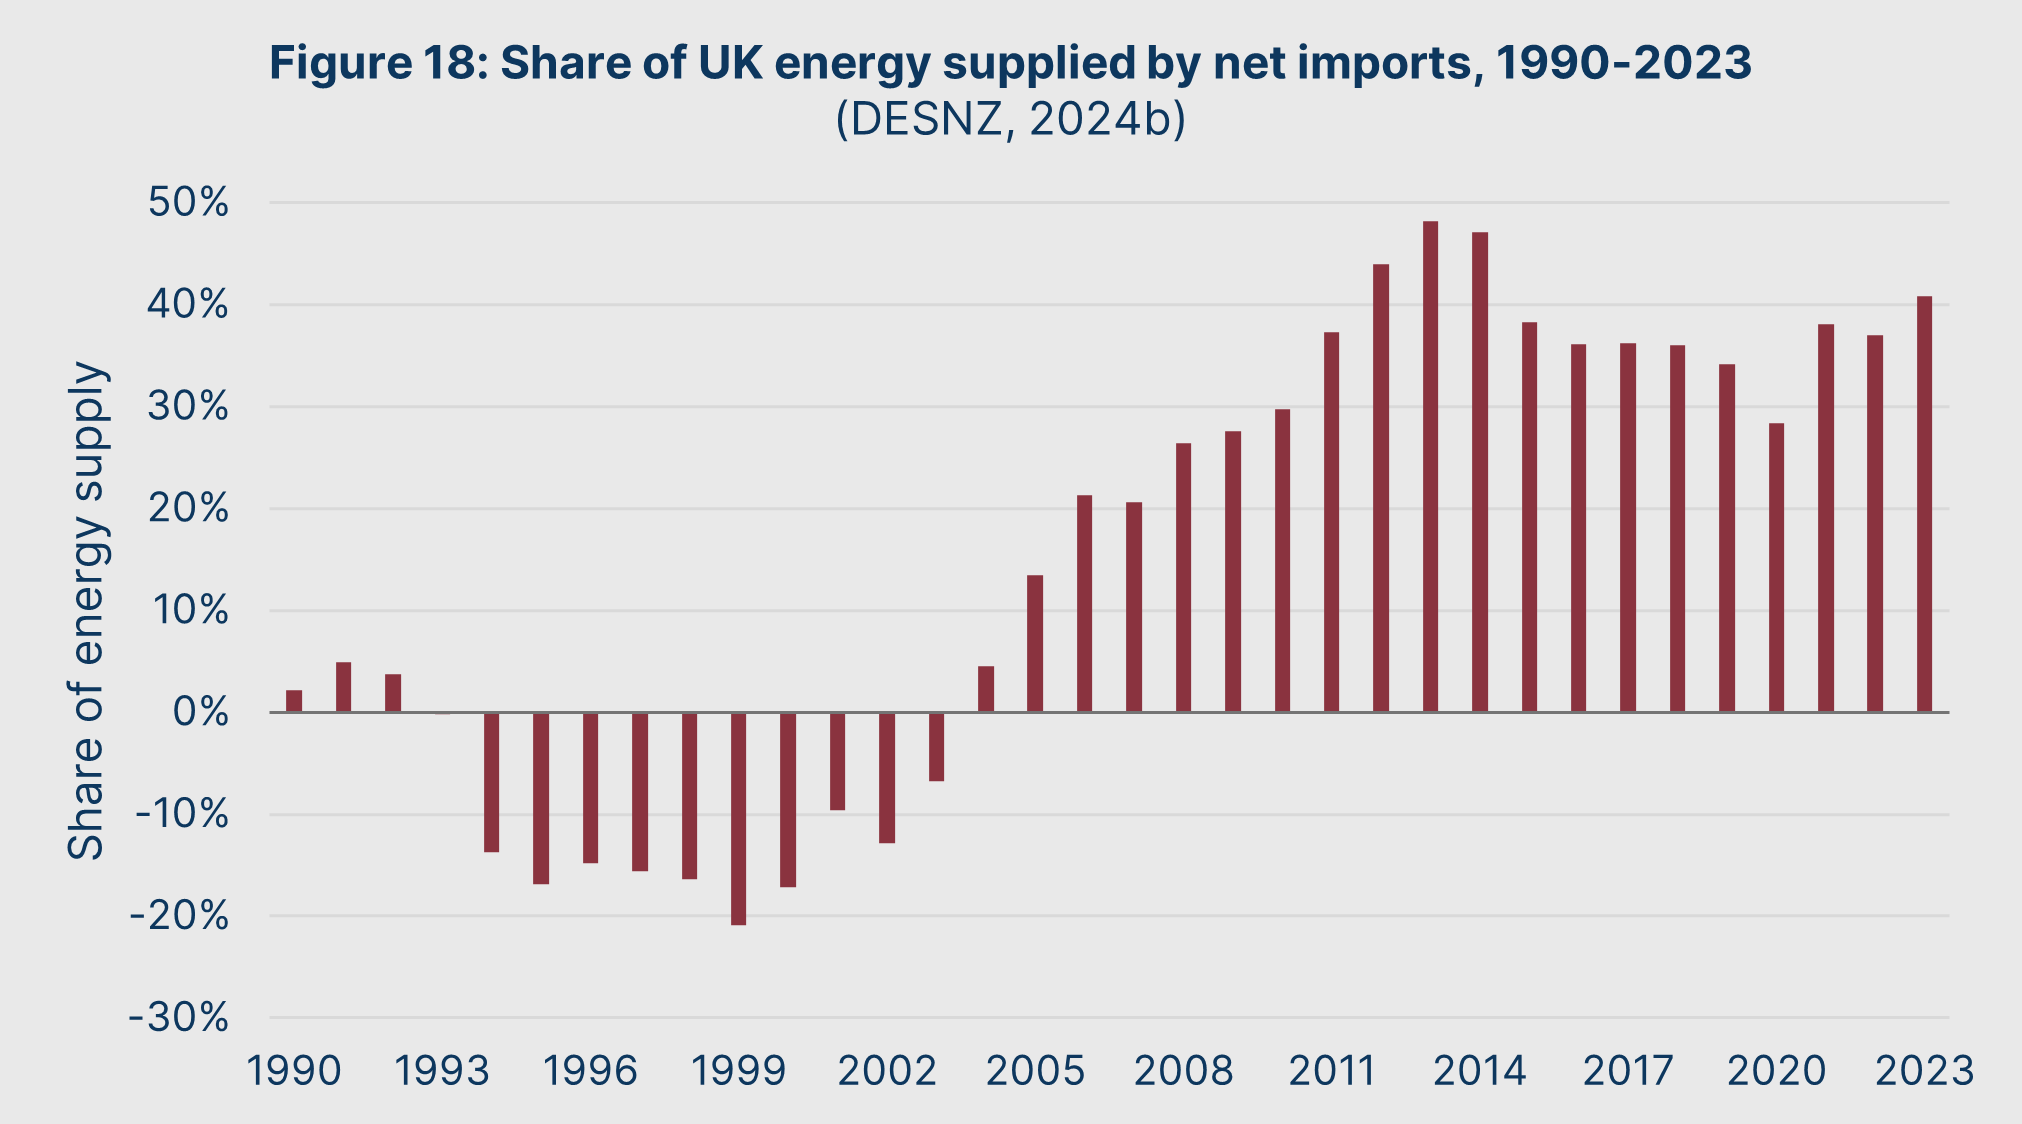
In the late 1990s and early 2000s, North Sea reserves had allowed Britain to finally enjoy a position as a net energy exporter. But then domestic gas production began to crater, falling by 73.8% between Q1 2003 and Q4 2023 (DESNZ, 2025b). The result, as shown in Figure 18, has been a shift towards being a net importer of energy.
Needless to say, a three-quarter drop in domestic production – which will enjoy significant logistical, transport, and storage savings compared to gas from foreign markets – can amply explain general gas price inflation.
This drop in domestic production has not been because North Sea oil and gas was depleted. Rather, domestic production has fallen because of a deliberate policy to prevent new projects from opening to replace exhausted sites. Through a system of onerous exploration licenses and site development approvals, many viable projects have been deliberately stalled by successive governments for decades. Endless departmental vetoes and judicial reviews of applications have meant a ban-by-stealth for most new oil and gas projects.
This can be seen through the length of time projects have been forced to sit within the approval process. In 2023, ten explored sites were nearing final rounds of approval for construction – the average time they had waited was 33 years. (Energy Voice, 2023)
Along with bureaucratic deterrents, the oil and gas sector has been subjected to various financial penalties that have killed incentives for investment in exploration and sites. These include carbon taxes and windfall profit levies in times of energy supply shocks. When combined with moratoriums on new licenses and endless delays to approvals, the result is that the sector is a loss-maker: in the year ending July 2024, the net rate of return for offshore operators averaged -1%. (S&P Global, 2025)
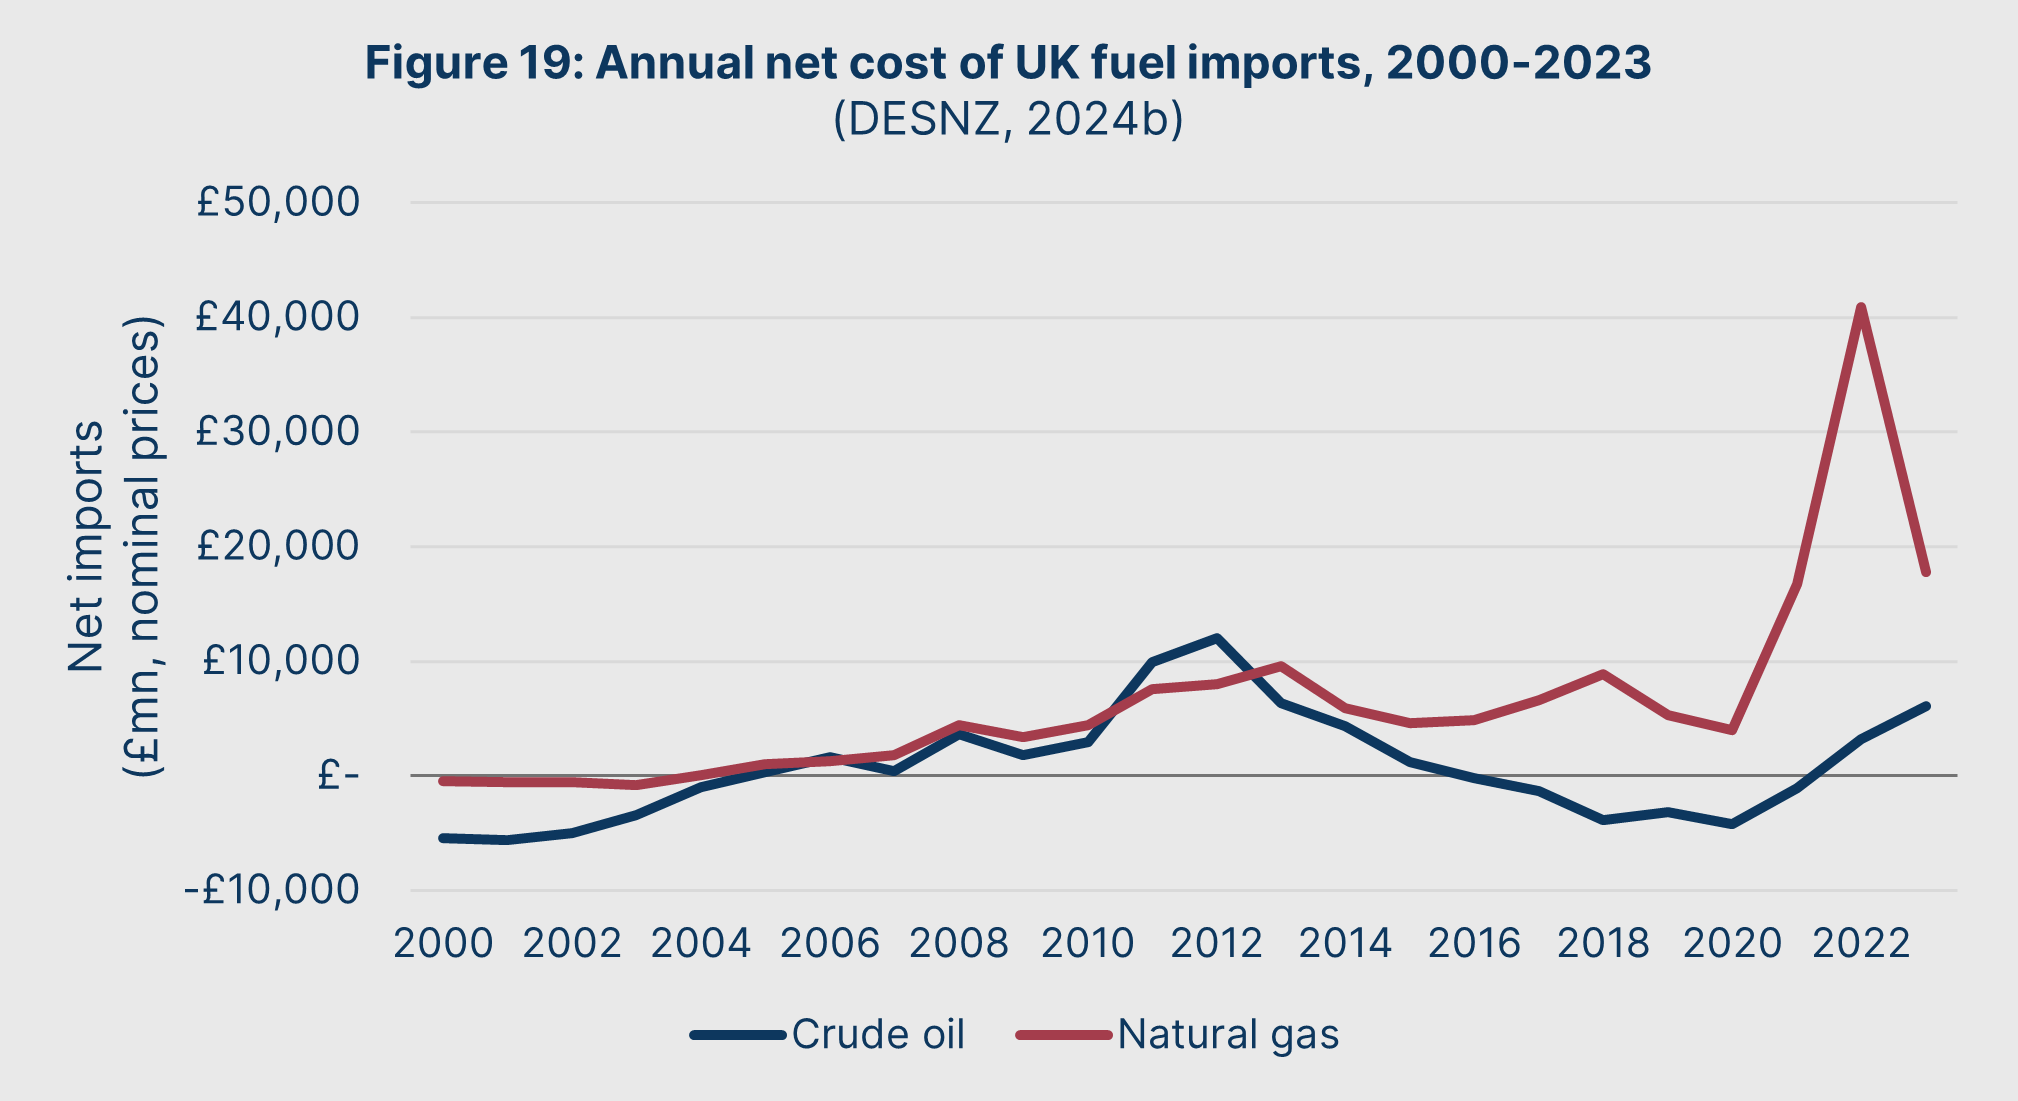
Imports have thus filled the gap, and exposed Britons to global oil and gas supply shocks. Along with pushing up prices for consumers, it has also created a significant driver to the trade deficit. Figure 19 illustrates the magnitude of the oil and gas trade deficit over time: between 2000 and 2023, total net gas imports stood at £155bn, and total net oil imports stood at £20bn.
Macroeconomically, a multi-year energy trade deficit that totals more than £175bn has major ramifications. Unless a trade deficit produces significant economic growth that covers its cost, that deficit must instead be financed by either taking on debt or selling off assets. In such a case – as with Britain during its long stagnation – this means a trade deficit serves as a massive wealth transfer out of the country. The energy import system is structured so as to beggar the nation.
All of this could be avoided through domestic production, by further encouraging exploitation of North Sea oil and gas. Potentially, by also allowing onshore exploration, Britain could also unlock shale gas reserves to augment the North Sea. Instead, by starving supply, consumers and the country are both poorer.
Earlier, in Figure 11, we saw that 77.6% of the change in nominal net energy prices between 2004 and 2024 was due to increases in non-wholesale costs. To understand why these non-wholesale costs have risen, we must understand their relevance to a new renewable-dominated energy system.
Even after de-rating, intermittent renewables are vulnerable to a challenge that we may dub the temporal mismatch problem: the problem of aligning supply and demand if we have limited control over the timing of either.
Consider a mock supply and demand curve facing an intermittent renewable energy system over the course of a day. For the sake of simplicity, we will hold demand constant throughout the day and assume that there is no ramp-up or ramp-down period for generation.
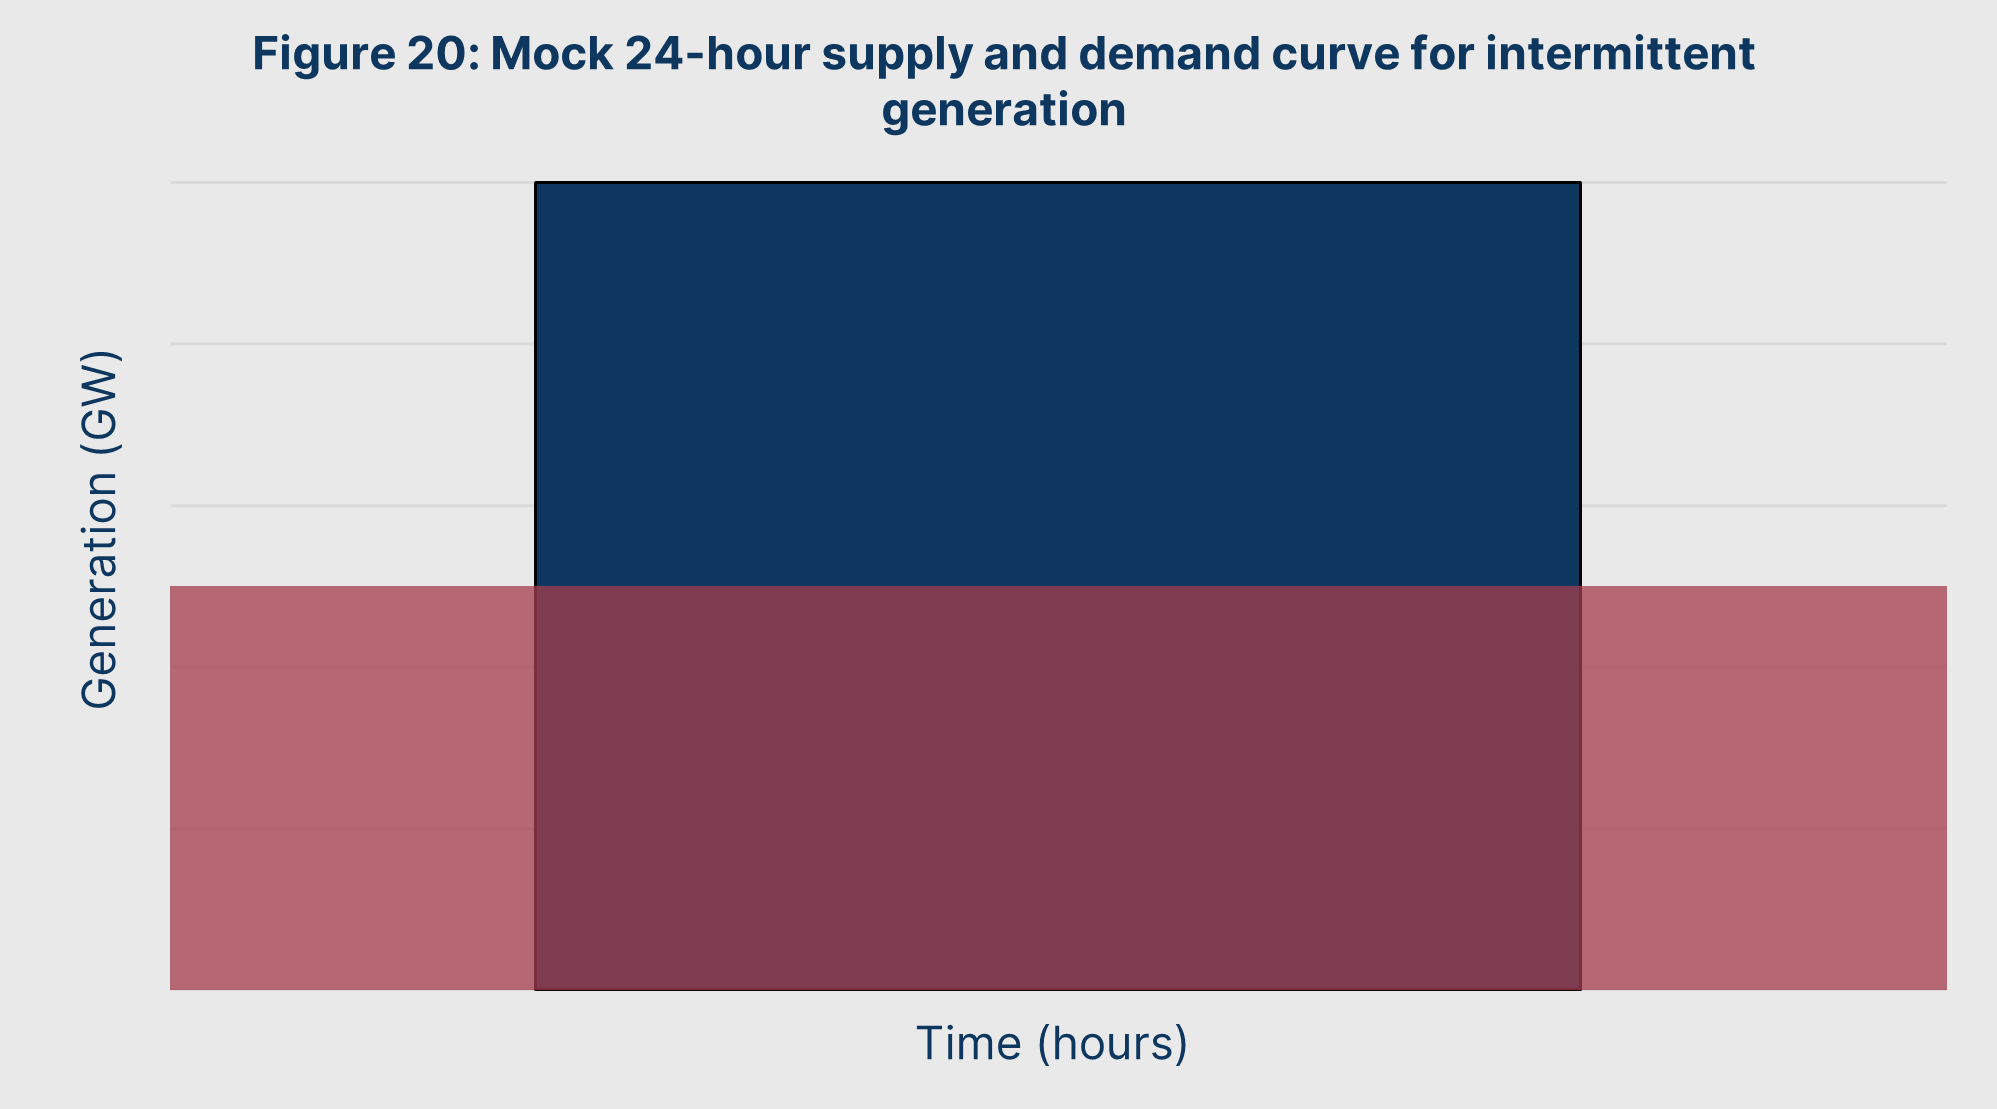
To avoid wasting energy – and ensure that the renewable source can sell its energy at LCOE values – all excess energy provided during the blue surplus period needs to be distributed to the red deficit period. If it is not, then non-intermittent capacity will need to come online, or the grid will fail.
Britain faces unique challenges in addressing the temporal mismatch problem. We are one of the highest-latitude economies in the developed world, which dramatically limits our hours of available sunlight per year. The result is that wind will necessarily be a major backbone of an intermittent renewable energy system, which in of itself comes with some considerable risks of low-wind periods.
As a result, even extreme over-investment in renewable resources cannot reliably meet our year-to-year energy needs. Tong et al (2021) explain the nature of the problem in stark terms: even if Britain overbuilds three times more de-rated capacity than demand (assuming an optimal split favoured towards offshore wind), and also installs enough energy storage capacity to meet 12 hours of national demand, it will still need to have ready additional non-renewable capacity to meet up to 60% of demand throughout the year. This is shown in Figure 21.
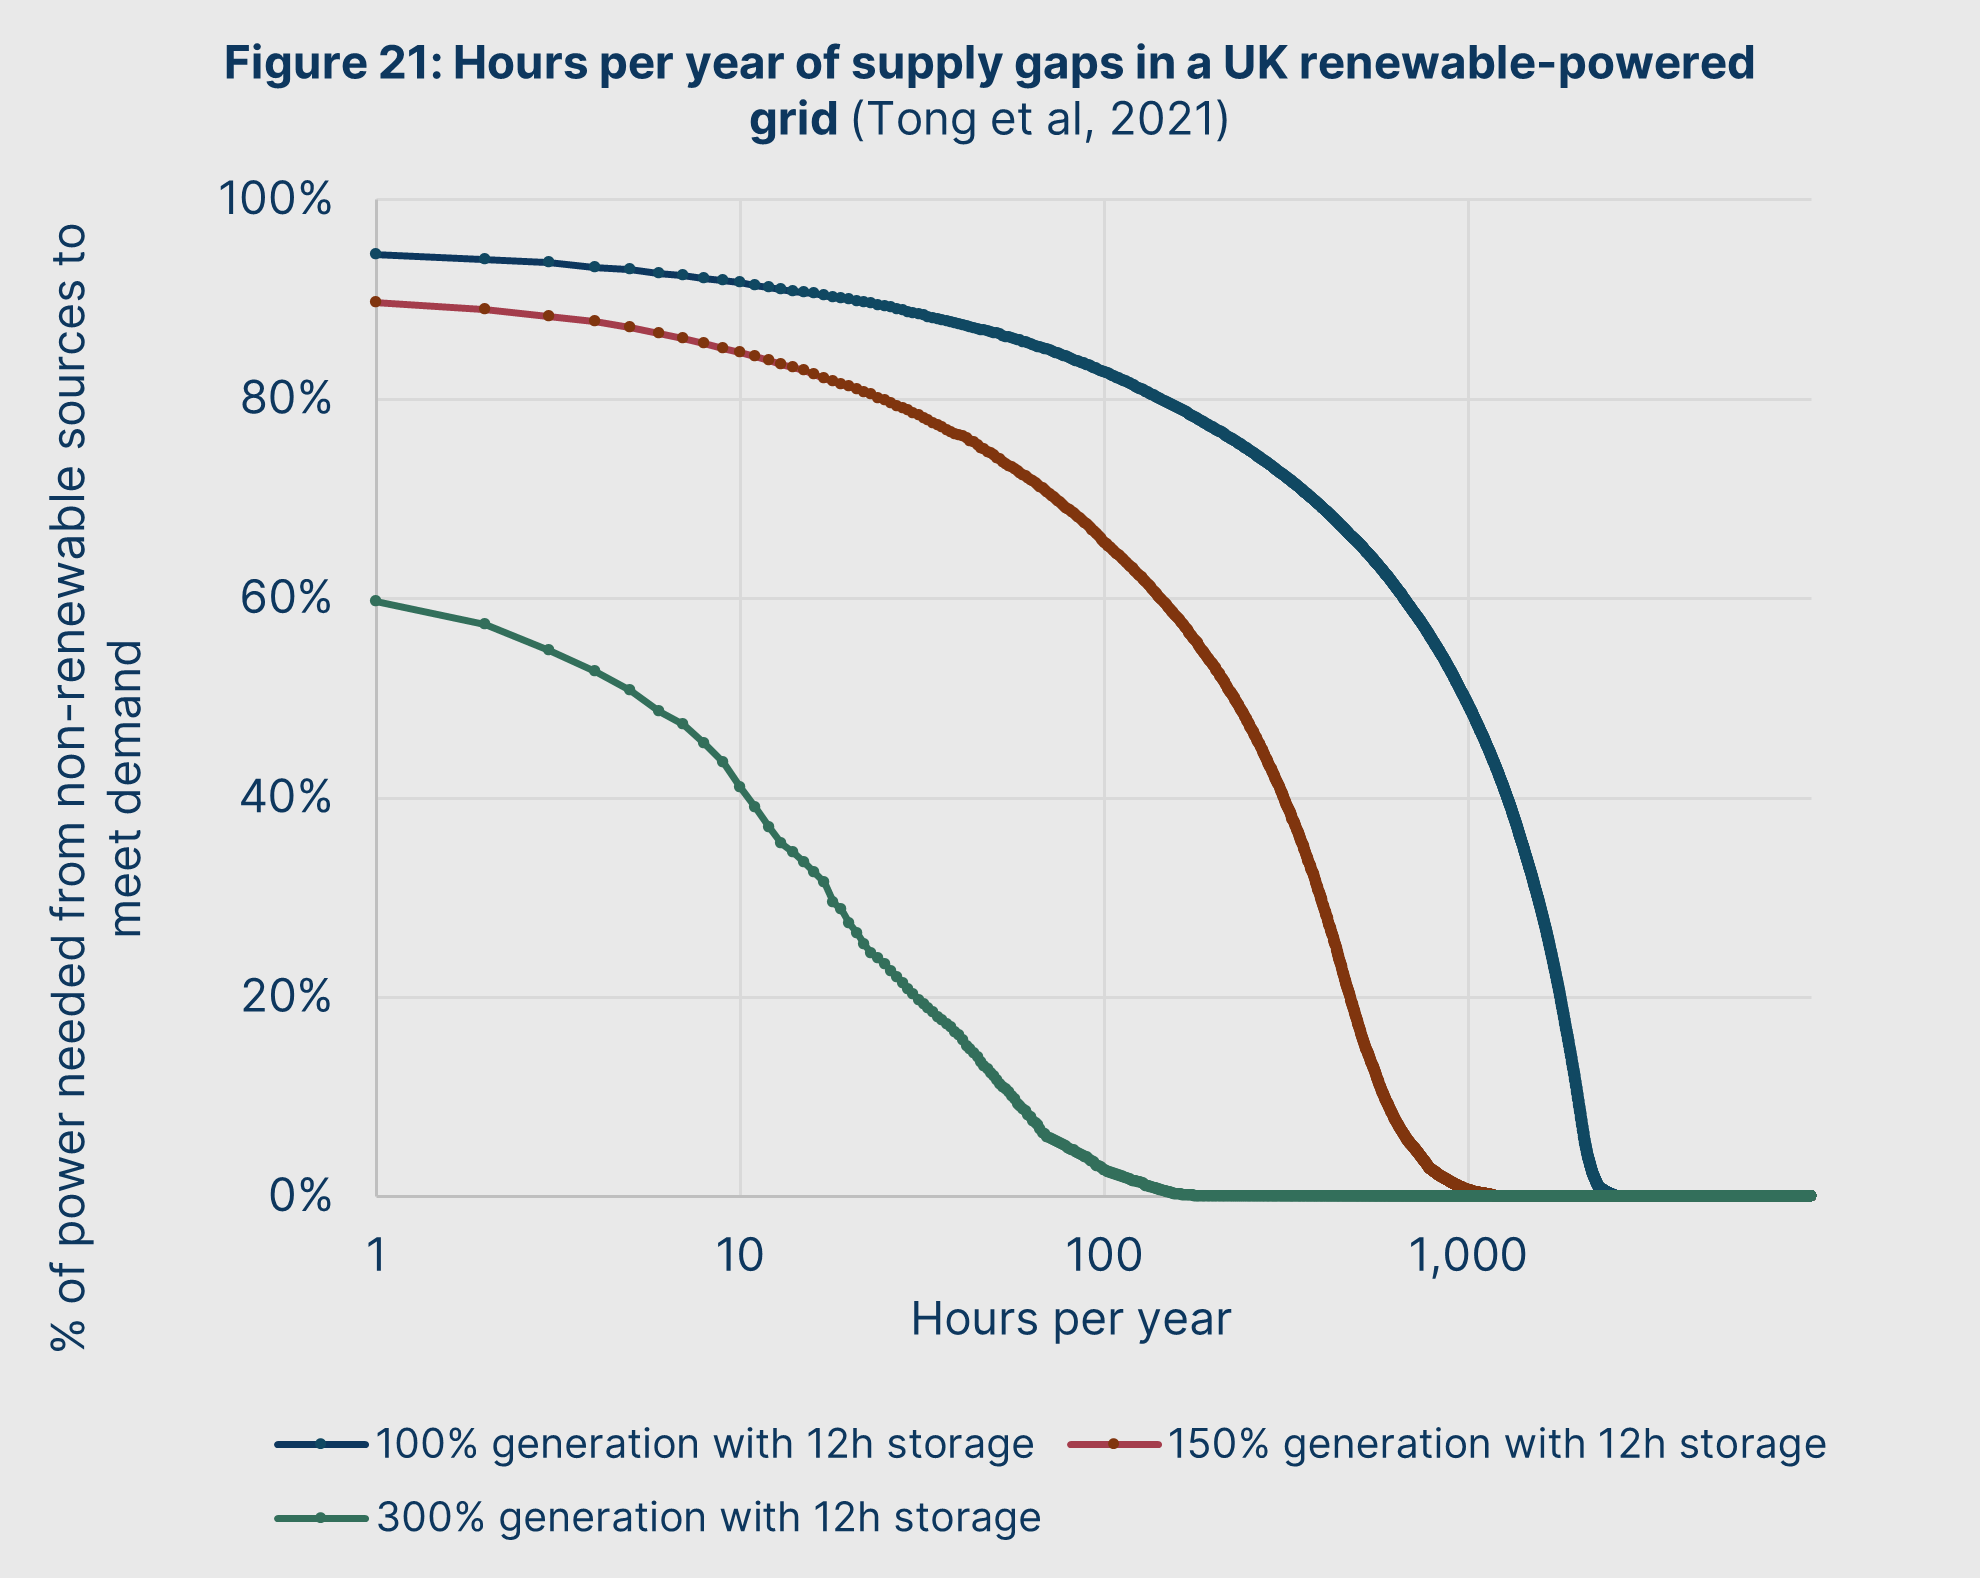
Approximating today’s total de-rated capacity to stand at 70GW across Britain, such a “hardened” system would require:
- 210GW of total de-rated generation – requiring 140GW of new generation capacity. At a conservative capital expenditure estimate of £2bn per GW, this would cost £280bn.
- 2500GWh of energy storage to meet 12 hours of needs. At a conservative capital expenditure estimate of £500mn per GWh, this would cost £1,250bn.
Such a £1.5tn programme – particularly the storage component – could be regarded as a necessary investment to make an intermittent renewable grid viable. It is the externality required to deliver nominally cheap renewables: the infrastructure needed to solve the temporal mismatch problem.
But even this is an incomplete solution. Firstly, it will still require 42GW of idle capacity on continuous standby – whether that be natural gas or potential imports via interconnectors – that that will need to be used for 4-5 days every year in total. But given that many days will require at least a few minutes of generation from these sources, in practice this additional capacity will require reserving for the full year. This is extremely expensive, with the recent 2028/29 capacity market auction pricing 1GW of capacity at £60mn per annum – for 42GW of capacity, that means £2.5bn per year. (Thompson, 2025)
But even more damningly, it also does not consider the fact that generation and storage infrastructure are subject to depreciation. In practice, a lifespan of twenty years for grid storage infrastructure would be exceptionally long. That means £1.5tn would need to be invested once every twenty years to enable grid-level adoption of intermittent renewables. Based on 2024’s economic output of circa £3tn, this means one out of ten years of output will need to be sacrificed in perpetuity to enable a grid based on wind or solar.
For obvious reasons, this £1.5tn programme has not been embarked upon. Rather, the government has pursued another solution: transforming the patterns of energy demand, by both reducing aggregate demand, and shifting demand to periods when it can be met with intermittent renewable. In policy, industry, and advocacy circles, this system is referred to as the “demand management” paradigm.
Three instruments are key to the demand management system:
- Policy costs. These are levied on consumers to finance the incentives and penalties to manage demand, in an attempt to enable renewables to play a significant role in the grid.
- Network costs. These represent the cost of building and operating the infrastructure necessary to provide the real-time intelligence needed to administer the system of demand management, and regulate the distribution of electricity in detail.
- Capacity markets. These exist to provide idle reserve generation as an “insurance system” to prevent grid failure in the event of any temporary misalignment between supply and demand.
Each of these costs have experienced unplanned growth over the decades. However, in recent years, a new form of energy system planning has begun to reemerge as the demand management system becomes more critical for grid stability. This has come in the form of the new National Energy System Operator (NESO).
Unlike the CEGB, NESO’s role as a planner is not to increase supply. Instead, the role of NESO is to reduce demand. The scale of this new planner’s ambition is truly monumental. NESO aims for a 54% reduction in peak demand by 2050 through a system of real-time “smart” tariffs. (Future Energy Scenarios: Path to Net Zero, 2025, p. 37)
We refuse to use the label of “demand management.” It is a disingenuous euphemism that hides the true nature of this system from the British public. This is a system designed explicitly to limit our use of energy. It is a system of rationing.
As it would be impossible to finance the £1.5tn in infrastructure required to make our current economy depend on intermittent renewables, the government has instead chosen to pay for renewables indirectly. This indirect cost is the lost output caused by the nation’s energy rationing system: the £3 trillion from lost productivity and output we explored in Part 1.
Thus, finally, we can now explain the sequence of the energy crisis:
- In the 1980s and 1990s, the abandonment of planning fragmented the energy system, and decoupled macroeconomic considerations from energy provision.
- Private operators in the energy system ran down the asset base and pursued “efficiencies” that had significant social externalities, and also pursued incentives that were at odds with the general interest.
- From the early 2000s, the pursuit of emissions reduction created a market distortion that encouraged over-investment in wind and solar generation. To make this grid viable, a system of demand suppression via price mechanisms has been implemented – a system of rationing.
The sheer economic ruinousness of this course of action was only possible because no single agent was required to price in the general national interest.
- Generators and suppliers maximised returns available via the distorted incentive structure, through projects encouraged via government financing schemes such as Renewable Obligation Certificates and Contracts for Difference.
- Network operators increased their earning potential through taking on the administration of the new rationing system.
- Policymakers and activists enjoyed moral righteousness from raising policy costs to directly curb energy supply, and throttling investment in new oil and gas extraction, but did not have to navigate the opportunity cost caused through depressed productivity and economic activity.
The effect has been to impoverish us all.
DISCUSSION 4:
THE SPURIOUSNESS OF NET ZERO
No discussion about energy policy can today take place without mentioning the issue of greenhouse gas emissions. In just a generation, a widespread consensus has emerged across British state and society: that anthropogenic climate change represents an existential threat, and that preventing it through emissions reduction is the greatest moral imperative of our time. We reject these claims.
First, anthropogenic greenhouse gas emissions at current levels are not an existential threat to life on Earth. It cannot be doubted that, logically, greenhouse gas concentrations have a causal role in relation to the Earth’s surface temperature. However, emissions at their current levels would need to continue for tens of thousands of years before any such existential threat were to emerge.
This is because, in geological terms, atmospheric carbon dioxide levels are approaching their lowest ever since macroscopic life as we know it emerged circa 500 million years ago. The past 2.6mn years where significant polar ice caps have existed on Earth are an anomaly in Earth’s history. This relatively novel period is called the Quaternary glaciation.
If we view the Quaternary glaciation and today’s low concentrations of greenhouse gasses as the anomalies they are, we can see that the biosphere has significantly more capacity to absorb carbon dioxide than activists claim.
Second, the non-existential risks posed by anthropogenic greenhouse gas emissions – disruptions from rising sea levels via polar ice cap melt, and extreme weather events – are also not of an unprecedented character nor should we expect them to occur abruptly or linearly. To the extent these relationships exist, they exist in the form of multi-century or multi-millennia trends, rather than over the course of a few human lifetimes.
A good example of this can be found in the glacial losses that drive rising sea levels. The mass and volume of the Antarctic ice sheet, which contains approximately 90% of the Earth’s ice, does not track atmospheric greenhouse gas concentrations in realtime. This can be seen in the fact that the Antarctic ice sheet has abruptly begun to increase in mass since 2021 at a rate of around 110 gigatonnes a year, reversing the 2011-2020 trend of losing around 140 gigatonnes a year. (Wang et al, 2025)
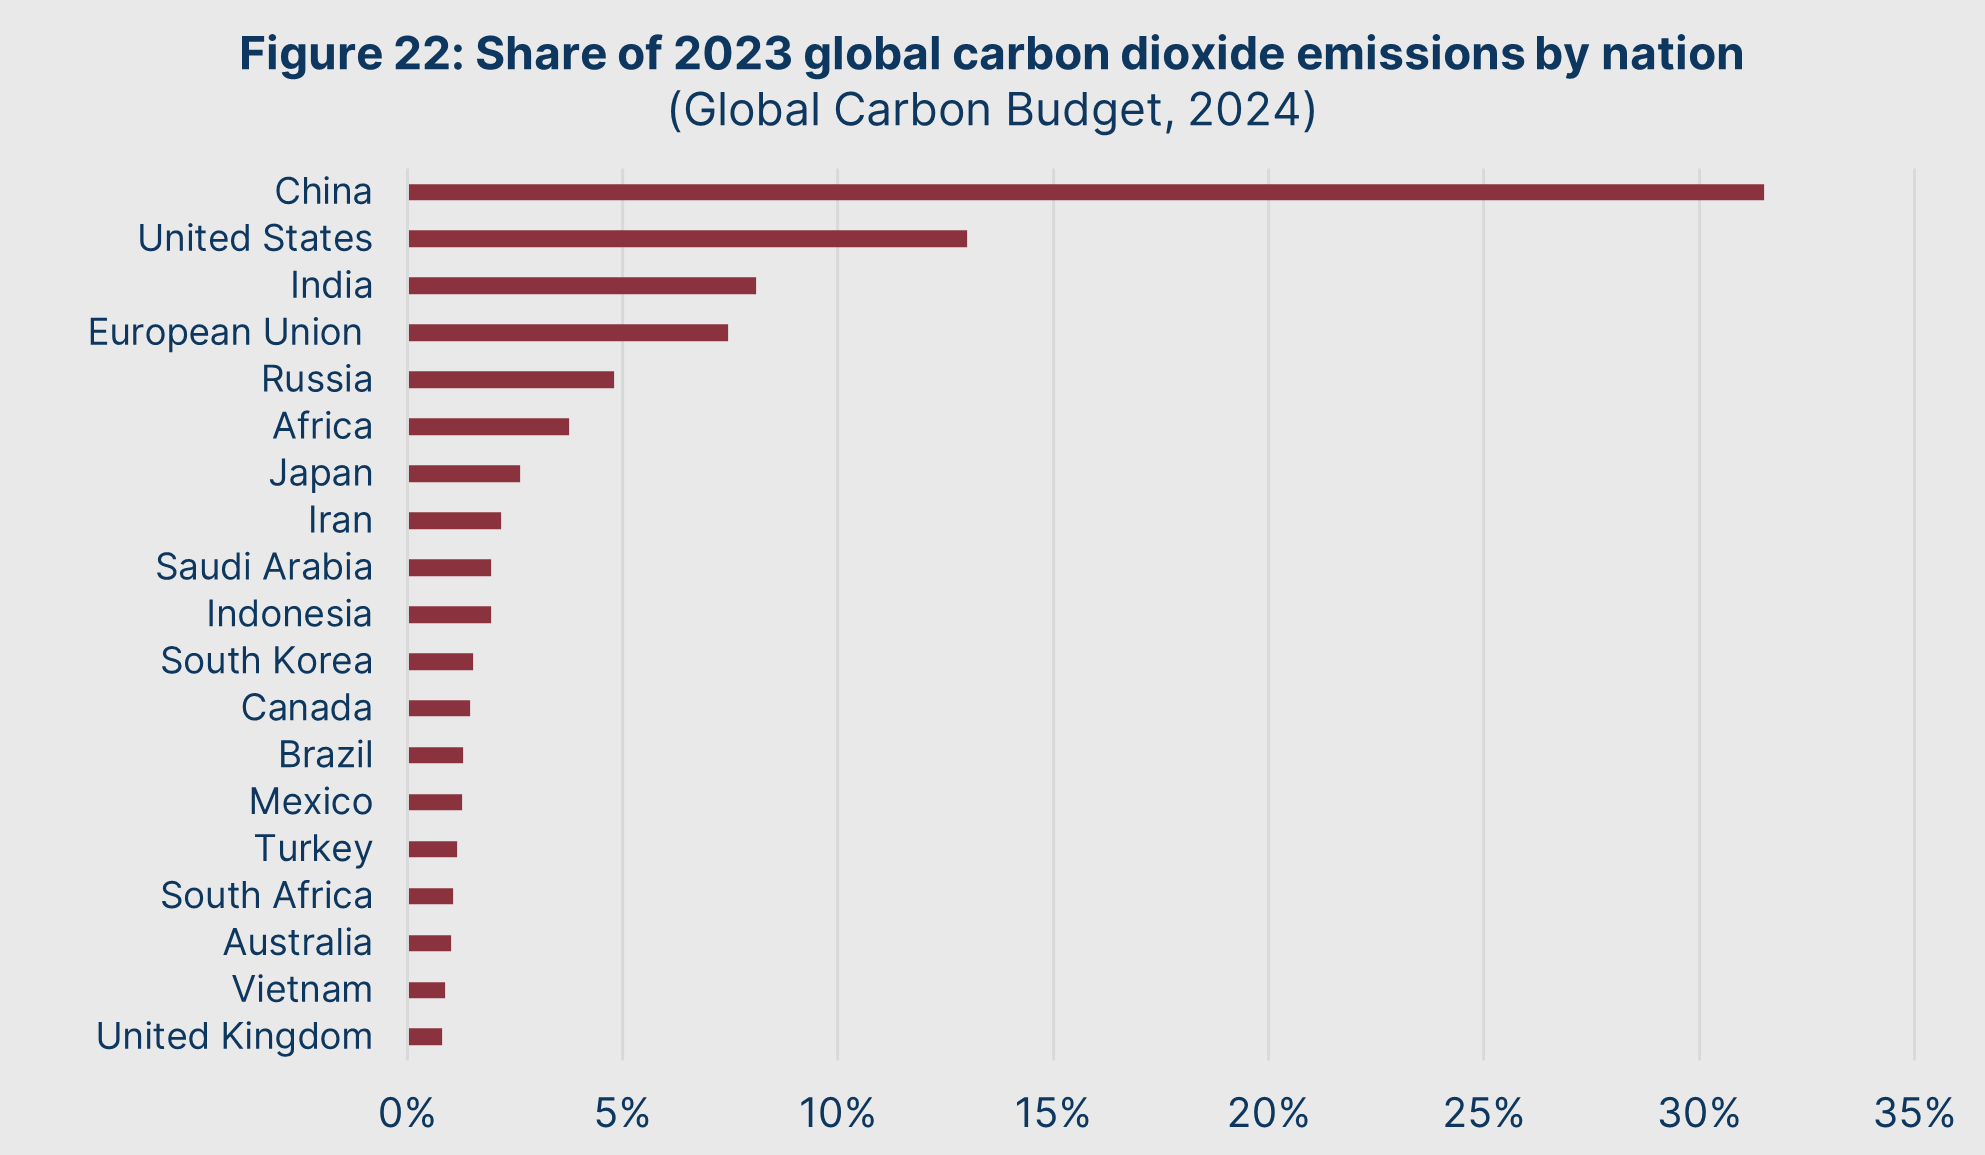
Third, Britain’s actual role in global greenhouse gas emissions is minute. Along with having achieved significant improvements in energy efficiency over the decades, the reality of relative population size itself means that our contribution to global emissions is destined to be insignificant. Rather, it is the larger developing or middle-income nations – particularly those like China or India, whose per capita emissions are radically increasing year-on-year – which are the major emitters. This is shown in Figure 22.
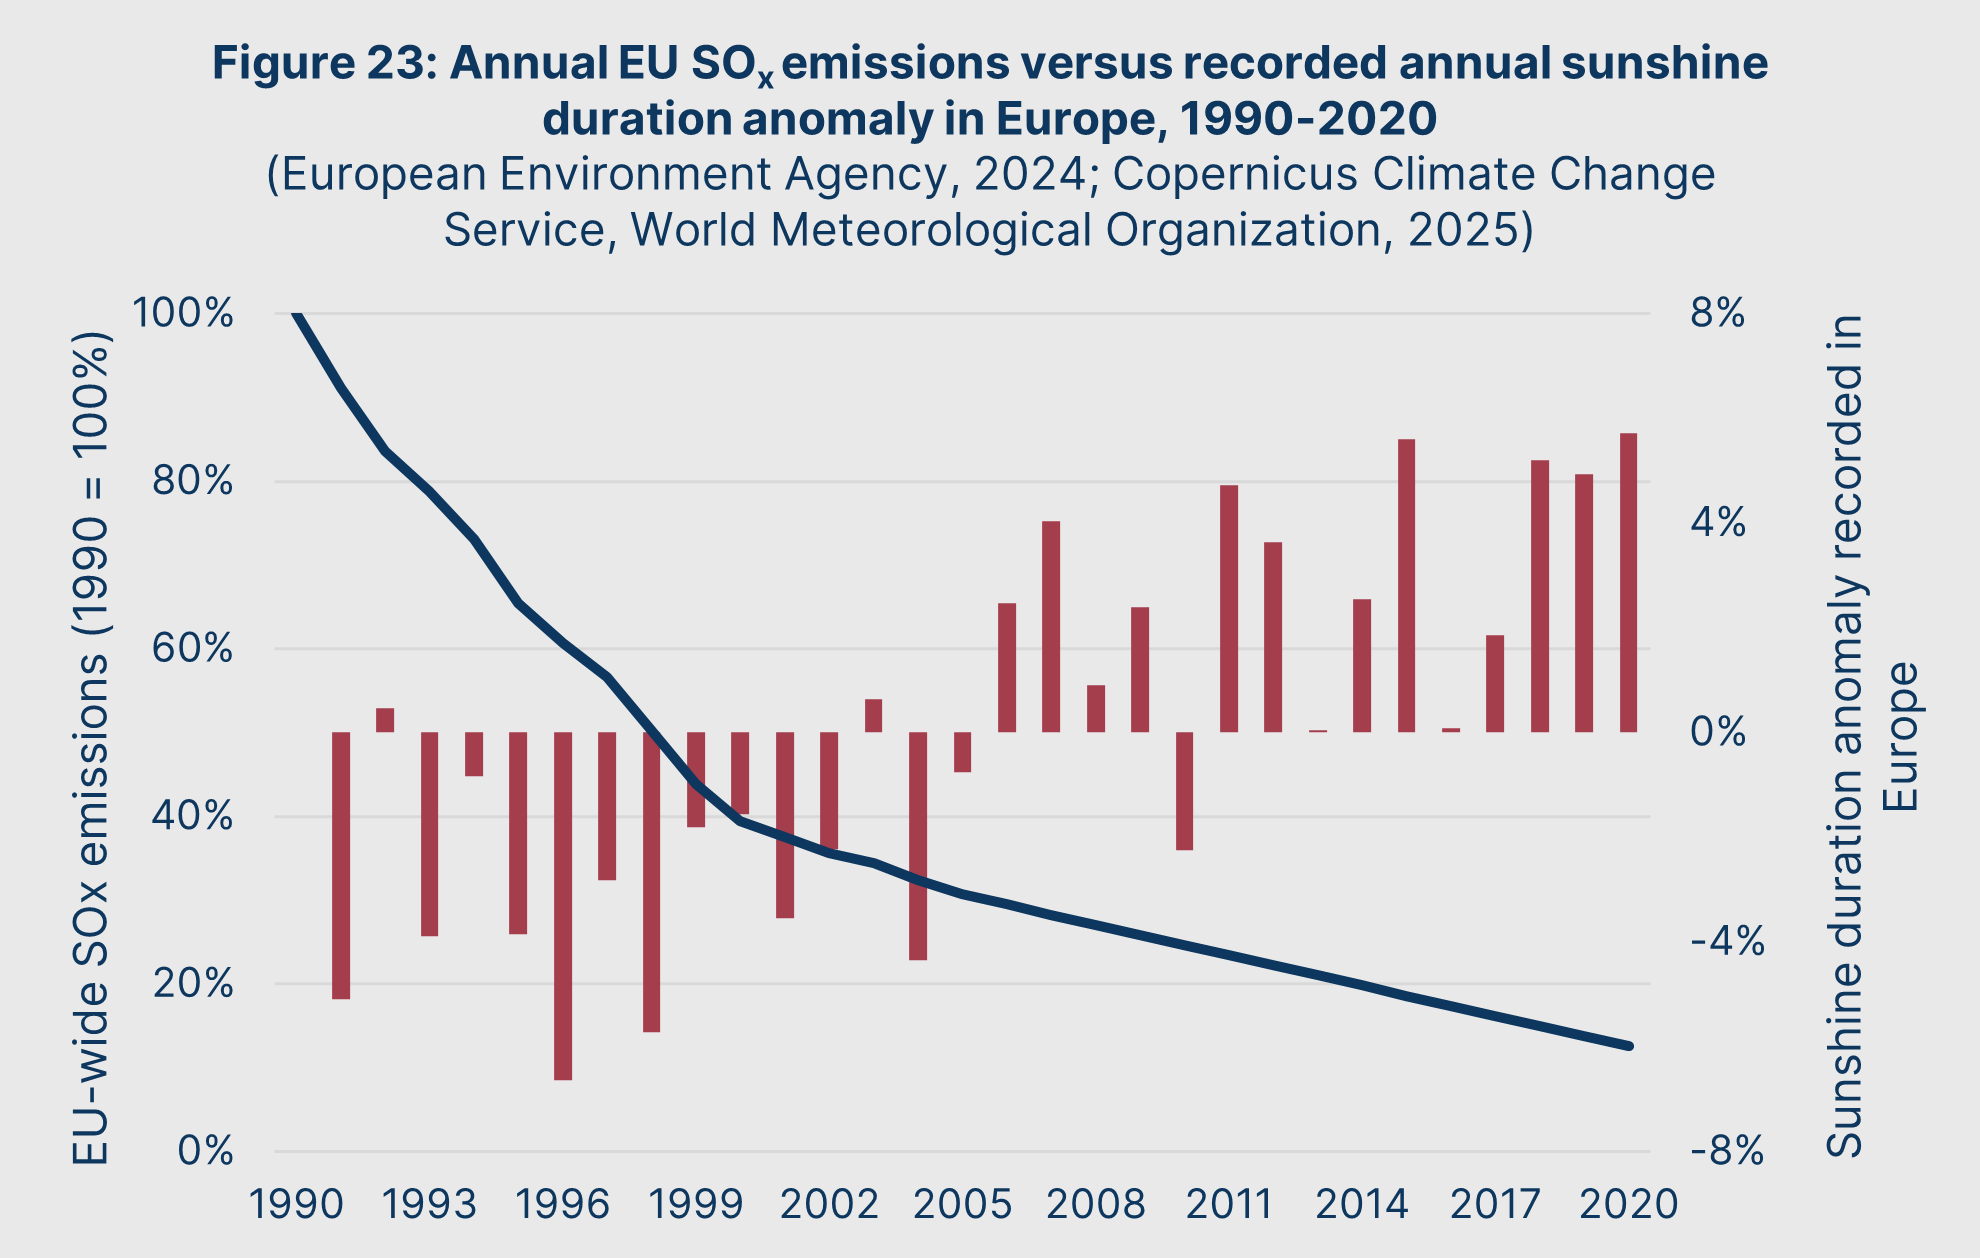
Fourth, we also underestimate the number of tools humans have available to tackle these non-existential risks. One good example is through sulphur dioxide, a potent “icehouse” gas. A single gram of sulphur dioxide can offset the warming effect of a tonne of carbon dioxide for a full year.
Since 2020, global atmospheric sulphur dioxide concentrations have significantly fallen due to improved shipping fuel standards, which have significantly reduced atmospheric sulphur dioxide concentrations. Yuan et al (2024) estimate that this is a significant driver of heatwaves in recent years, projecting a doubling of the 1980-2020 warming rate in the coming decades.
Indeed, we have seen this over time in Europe: its recent heat waves are largely due to an increase in solar radiation hitting the surface of Europe, the Mediterranean, and the North Atlantic. This solar radiation increase, as shown in Figure 23, has marched in lockstep with continent-wide initiatives to reduce sulphur dioxide emissions.
So, overall, we can see that:
- Atmospheric greenhouse gas concentrations do not pose a risk to the biosphere itself even over an extended period of time
- Sea level rises and extreme weather events cannot be expected to rise in an abrupt, linear manner
- Humans have significant ability to offset and control the global climate system in response to greenhouse gas emissions
- Britain’s own contributions to global emissions are causally insignificant
These are not partisan claims, but empirical observations. The impoverishment imposed on the country through a pursuit of decarbonisation at all costs is both futile and counterproductive.
A serious project to ensure multi-generational climate stability would be predicated on Britain driving the technology and innovation to boost the productivity of energy and reduce the pollutants per unit consumed. Such a serious project would not treat the natural world or the climate as some “other” that we must immiserate ourselves to appease, but as a complex system that must be stewarded by us for the sake of all life on Earth.
PART 3
A TEN-YEAR PLAN

Until the start of the energy crisis, total electricity supplied to the British grid grew at an annualised rate of around 2.6%. As we have explored so far in this Green Paper, explosive energy price growth began when this trend began to reverse. Figure 24 shows that had pre-2005 energy supply, consumption, and efficiency trends held, total annual electricity consumption would jump from 300TWh to 450TWh.
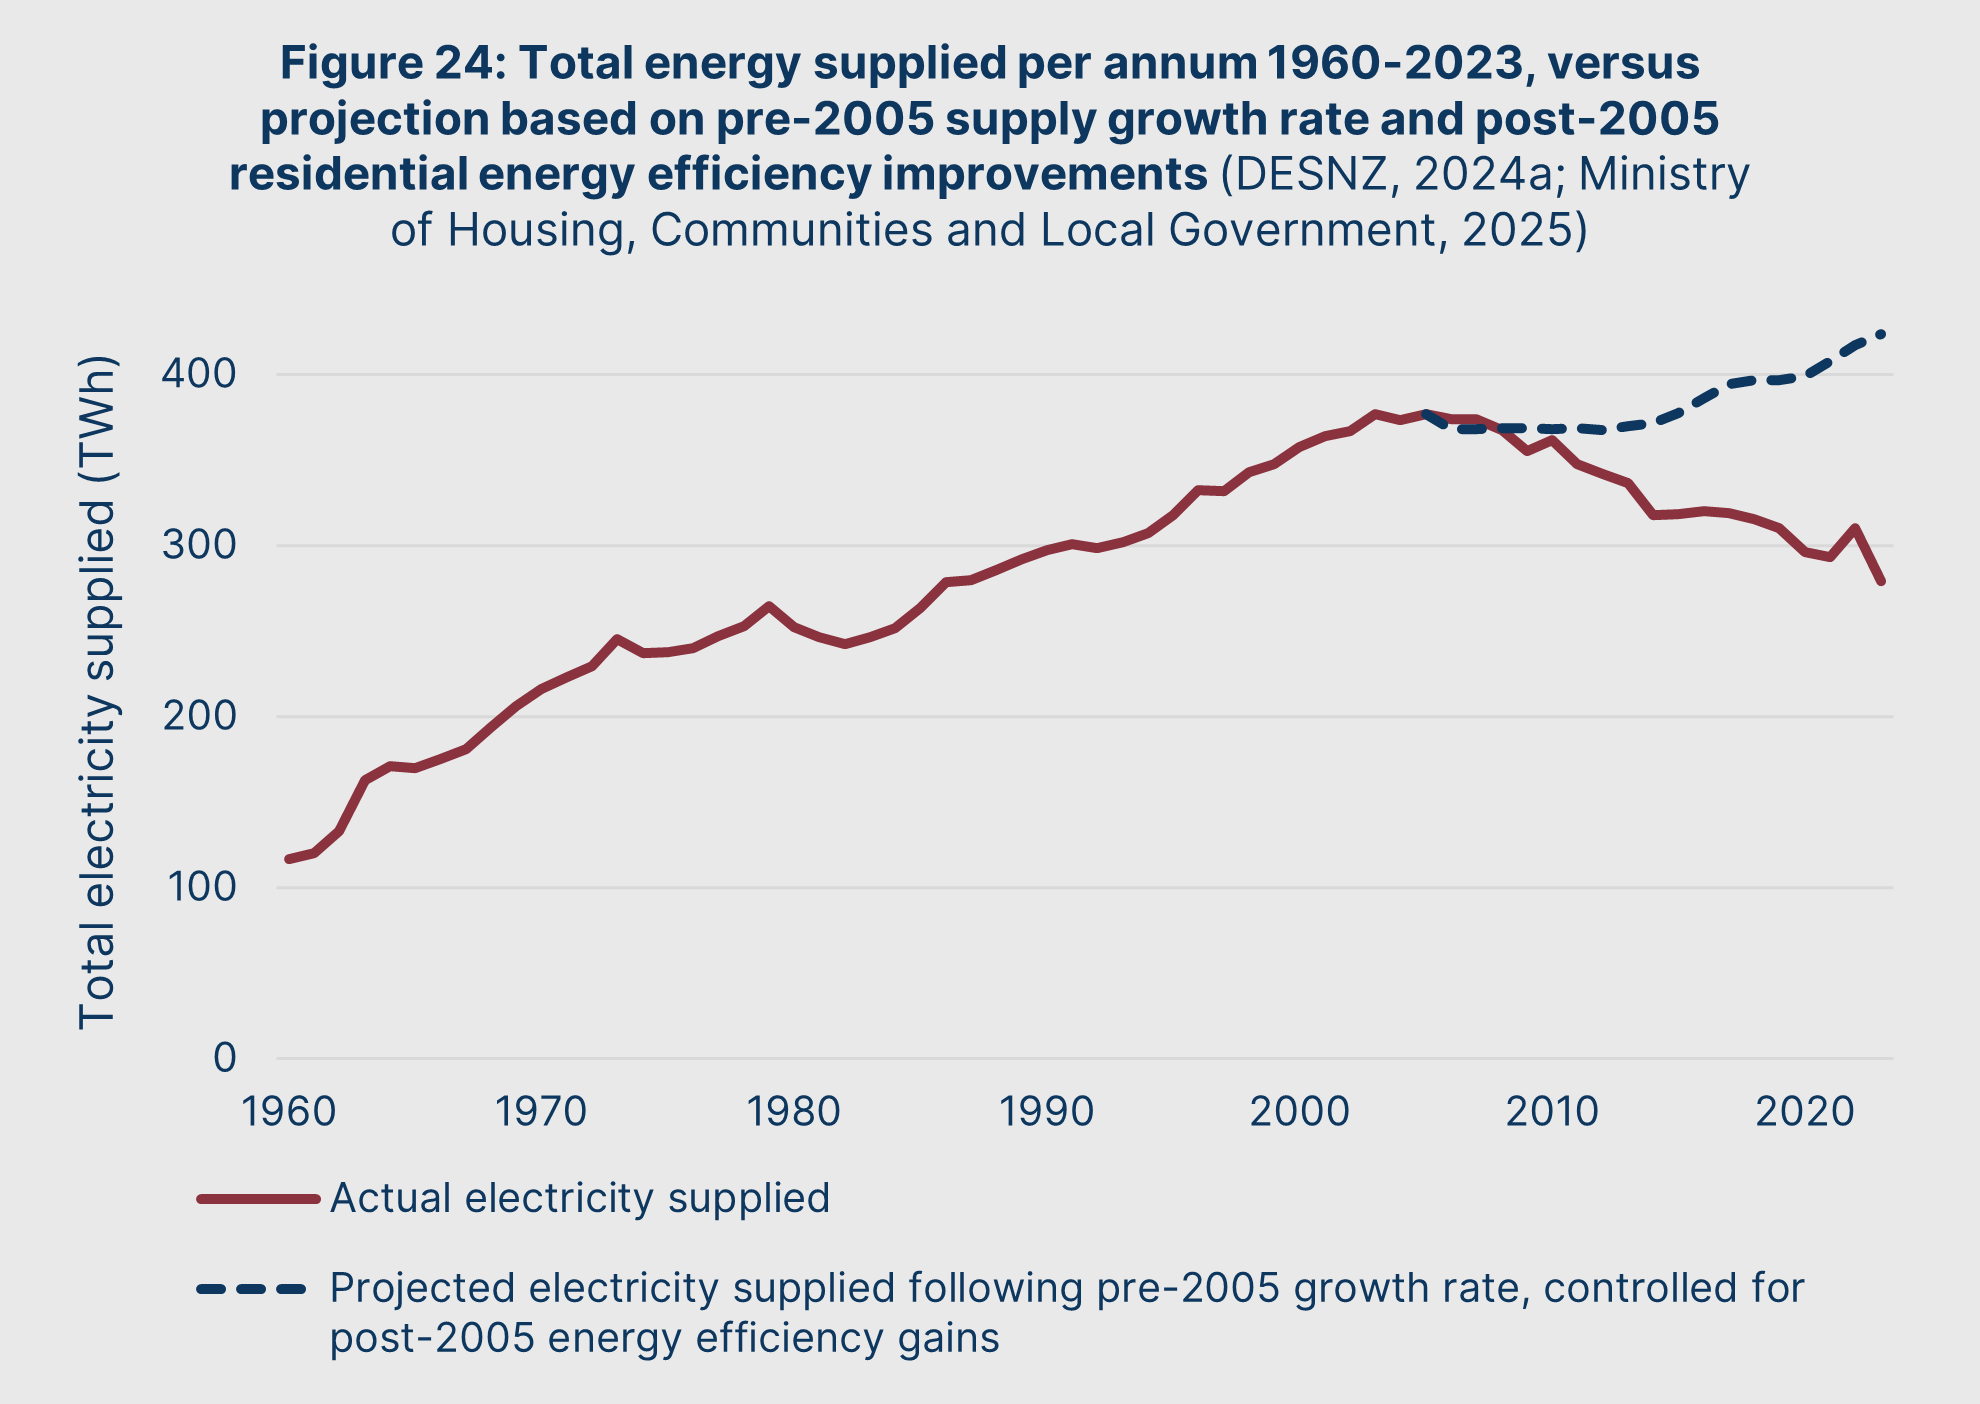
This 150TWh “supply gap” represents how much more energy must be supplied to restore the energy system and enable low prices for consumers. This is because, as we have argued, high energy prices should be understood foremost as rationing tools – elevated wholesale prices, policy costs, and network costs exist to suppress demand to avoid this restricted supply from being overwhelmed, and keep the grid from failing.
However, closing this supply gap is only part of the picture. Price stability will also require forward-building new capacity to anticipate supply in future years. In this section, we will explore how we will do both in a ten-year plan to correct Britain’s energy supply situation.
PHASE ONE:
GRID STABILISATION
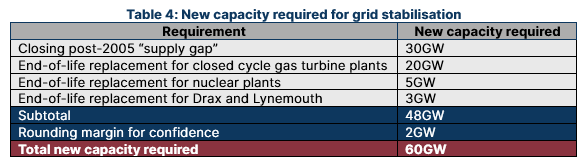
Assuming the 150TWh of the supply gap are spread evenly throughout the 8,760 hours of the year, the grid will require approximately 20GW of non-intermittent generation. However, in practice, this demand will not be spread evenly throughout the year, with some periods likely experiencing up to 50% spikes in demand – meaning at least 30GW of additional generation. This represents the minimum generation capacity needed to abolish the current demand management regime in full.
However, this supply gap is exacerbated by the amount of non-intermittent plant facing shutdown in the coming decade. This includes much of the gas turbines built during the dash for gas of the late 1990s and early 2000s, all the country’s remaining nuclear plants (aside from Sizewell B), and the two biomass power stations of Drax and Lynemouth.
This project – of rapidly constructing new capacity to dismantle the energy rationing system and replace generation capacity that will soon be reaching the end of its life – is one that we shall refer to as “grid stabilisation.” Table 4 breaks down the total generation capacity demanded by the grid stabilisation project:
We believe that the grid stabilisation project must be conducted with the utmost haste. This is because of the severity of the productivity opportunity costs associated with inflated energy prices (over £300bn per annum, as explained in Part 1), and the risk of grid failure as dispatchable capacity is run down and intermittent renewables as a consequence forms a higher proportion of the generating mix.
We propose the project of grid stabilisation to be completed within four years. In capacity terms, it will consist of two thrusts:
a) The construction of 40GW of closed cycle gas turbine capacity
b) The construction of 20GW of new coal-fired plant capacity
To expedite both gas and coal capacity construction, the number of “stakeholders” shall be limited – the task of constructing and operating these new plants shall be the preserve of a single, new organisation.
To honour the historic successes of the CEGB in building our modern energy system, we shall name this new entity “Central Energy.”
Central Energy will come into being through an eponymous act of Parliament, the Central Energy Act. This act will grant Central Energy immunity from the Town and Country Planning Act of 1990 and the Compulsory Purchase Act of 1965, allowing it to self-issue planning permission and compulsory purchase orders required for its projects. The Central Energy Act will also grant Central Energy access to government bonds to cover the financing costs for new power stations, with the expectation that all plants shall break even and repay their debts.
To construct the 40GW of gas turbine plant with minimal delay, Central Energy will be permitted to award projects for entire plants on a turnkey basis. Globally, there are few companies with the experience at building such bulk capacity in short timeframes.
In fact, there are only five that construct over 5GW of new gas plant capacity annually, as shown in Figure 25:
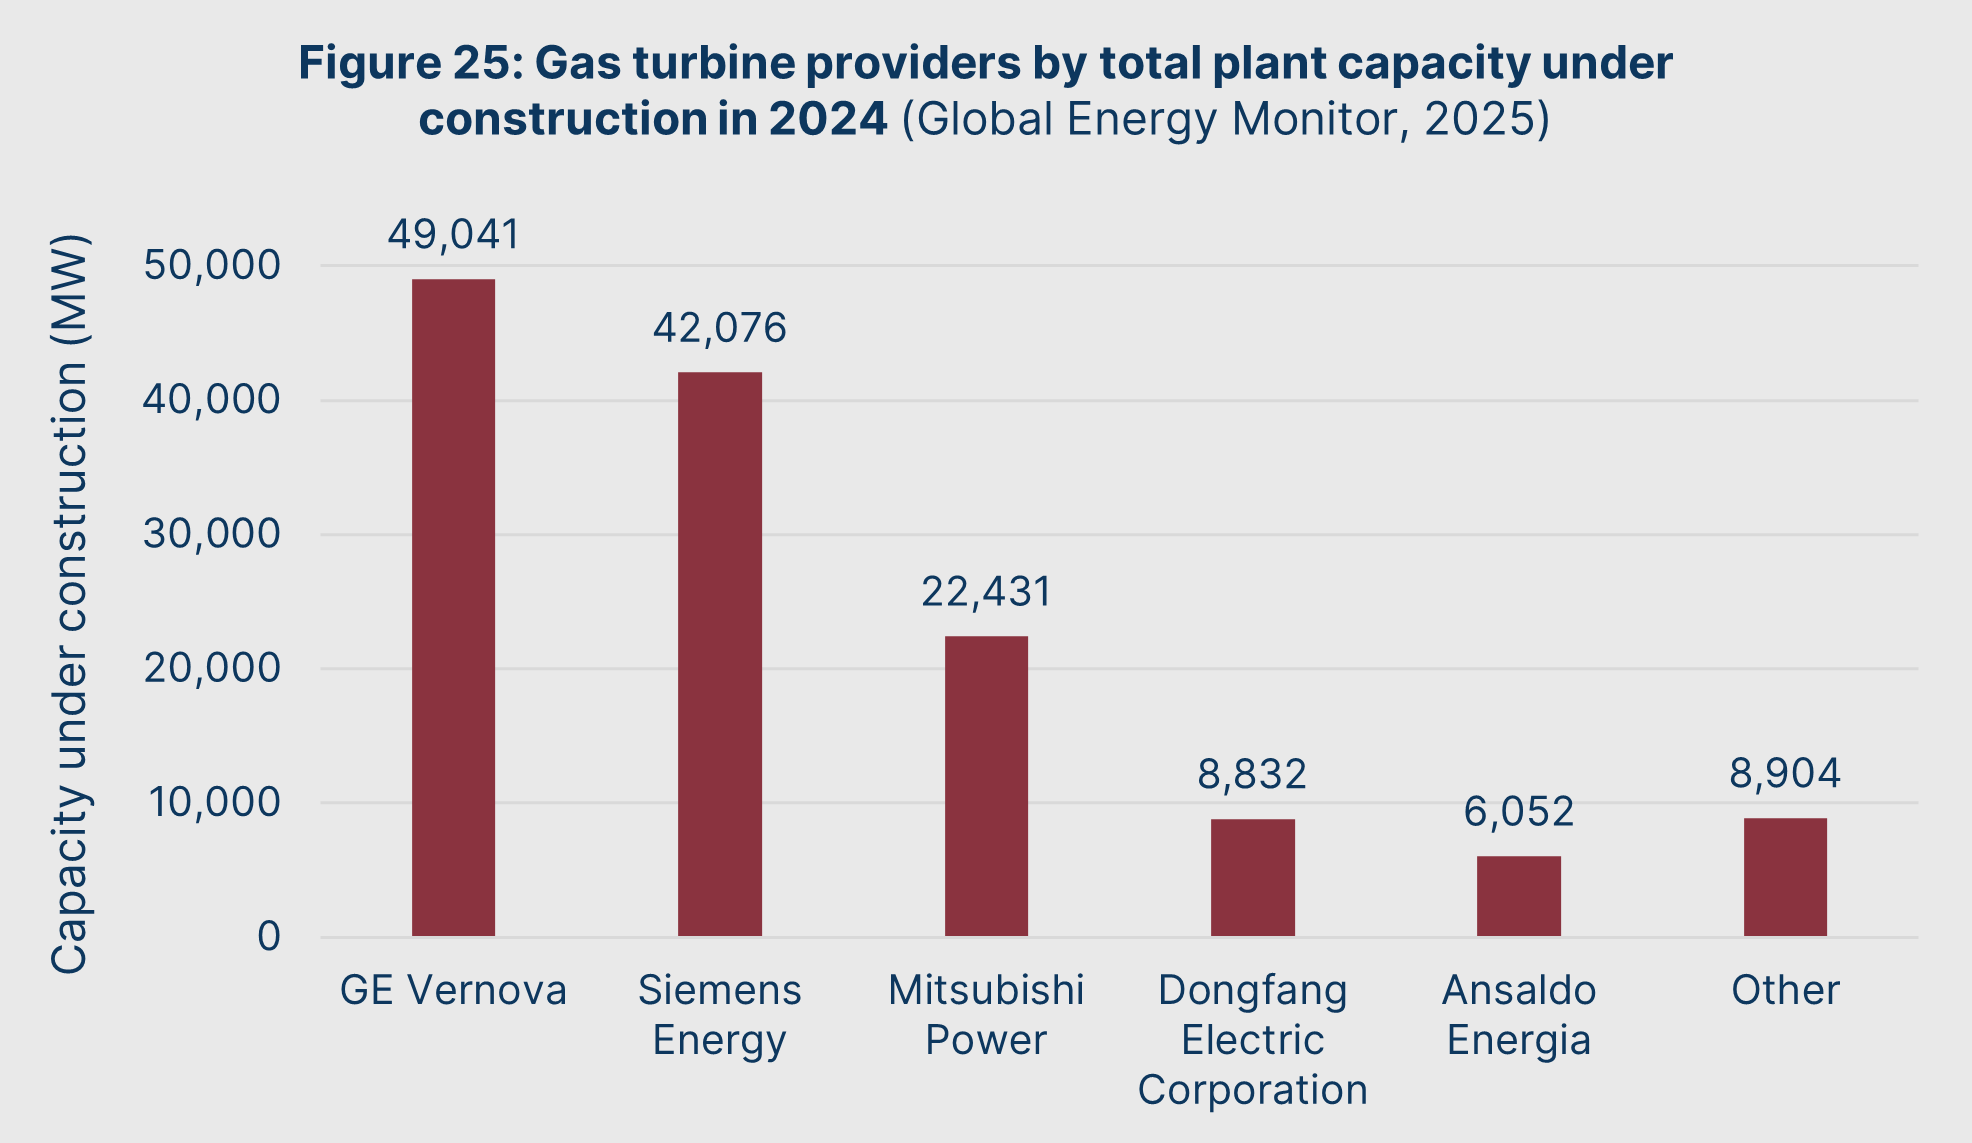
These providers have proved they can work with states to rapidly deliver “megaprojects” like that of our grid stabilisation initiative. A good example is Siemens Energy, who between 2015 and 2018 built three new gas power stations in just 27.5 months for the Egyptian government – with a total capacity of 14.4GW – at a cost of €6 billion. (Siemens Energy, 2018)
Two to three such mega-projects, each with a different supplier, is well within the realm of possibility.
To expedite this, Central Energy will also be given extraordinary freedom to conduct its own planning and environmental audits, be granted immunity to any process of judicial review, and have the power to issue compulsory purchase orders at its discretion. Conservatively rounding up to £500mn per GW, this entails a rough capital cost for of £20bn to construct 40GW of natural gas plant capacity.
A similar approach will be recommended for constructing the planned 20GW of coal capacity, based on the turnkey contractors with the greatest availability following the gas plant contracts.
Coal power stations take significantly longer to build than gas stations, owing to their reliance on fixed infrastructure such as rail and port access, along with the greater mass of fuel and machinery placing greater load on plant foundations. This means the best candidates for new coal plants will likely be the sites of recently demolished coal plants such as West Burton A or Ratcliffe-on-Soar. By using this land and leveraging the expertise of the engineers and operators of these late plants, we believe a four-year construction period remains realistic for replacement coal capacity.
For the sake of rapid progress, these new plants will not feature carbon capture and storage technology in their initial installation. This will produce significant cost and construction timeline savings – assuming £2bn per GW, the new 20GW of coal capacity will cost £40bn up-front.
Cumulatively, the capital costs for new generation capacity for the grid stabilisation initiative will cost approximately £60bn – spread out over the course of four years, this will cost £15bn per annum.
Thankfully, there is an ideal source of current spending that can be used to fund this commitment: the commitments on “net zero” capital investments mandated by the Climate Change Committee (CCC). As of the time of writing, the committee has mandated the government to spend anywhere between £6 and £23bn per annum on decarbonization projects by the mid-2030s. (CCC, 2025)
To free up this money, we will repeal the Climate Change Act of 2008. This shall abolish the CCC and all spending commitments it has forced upon the British people. We will use this money to fund the grid stabilisation initiative.
While Central Energy will be hands-on with the construction of new plants, we believe that the market is well-positioned to handle the question of fuel exploration and production. As explored in Discussion 3, we believe the oil and gas sector can rapidly increase domestic production and reduce the price of hydrocarbons.
North Sea oil and gas is the case in point of this dynamic. There remain at least 12 billion barrels of oil and gas ready for extraction in the coming decades – a conservative estimate, but one which represents £350bn of gross value add between 2025 and 2050 if fully exploited. (Offshore Energies UK, 2025)
To this end, we would first repeal deterrents to investment such as the post-2022 “windfall profit” levy on energy companies. Then, we would pursue dramatic liberalisation of the North Sea licensing and approval process, simplifying environmental requirements to focus on reporting tangible and reasonable steps to reduce local environmental contamination or habitat disruption. For onshore oil and gas via fracking, we would also dramatically reduce the planning hurdles required to develop new sites.
Finally, for the new coal capacity, we will begin by resuming imports. However, Central Energy will encourage the opening of new coal mines by industry through offering domestic production a preferential price compared to global markets, along with providing new mines with equity and debt financing to get started. As explored in Discussion 5, our belief is that if nurtured over time, British mines could produce critical industrial inputs and build a significant export market in the long term.
With the grid stabilisation project complete, we can then fully deconstruct the demand management regime without fears of grid failure. This will include the repeal of all policy costs, the cancellation of all investment in unnecessary network infrastructure, the cessation of reservation for idle “capacity market” generation, and the abolition of all carbon costs in wholesale prices. With this, we will have nullified the most extreme post-2004 excesses of the energy crisis and will have restored the competitiveness of net energy prices.
However, our view of the origins of the energy crisis precludes complacency at this stage. While our proximate objective is satisfied, our ultimate objective – the restoration of a planned system that ensures energy decisions reflect societal and macroeconomic considerations – means we must go further. To this end, we turn to the atom.
DISCUSSION 5:
WHY SHOULD COAL BE INVOLVED IN GRID STABALIATION?
Coal faded out of the transport fuel mix throughout the twentieth century because of its low energy density as a fuel – it simply releases fewer joules per kilo burned than oil (whether it be as petrol or diesel) or natural gas (especially when it is pure methane). This is illustrated in Figure 26.
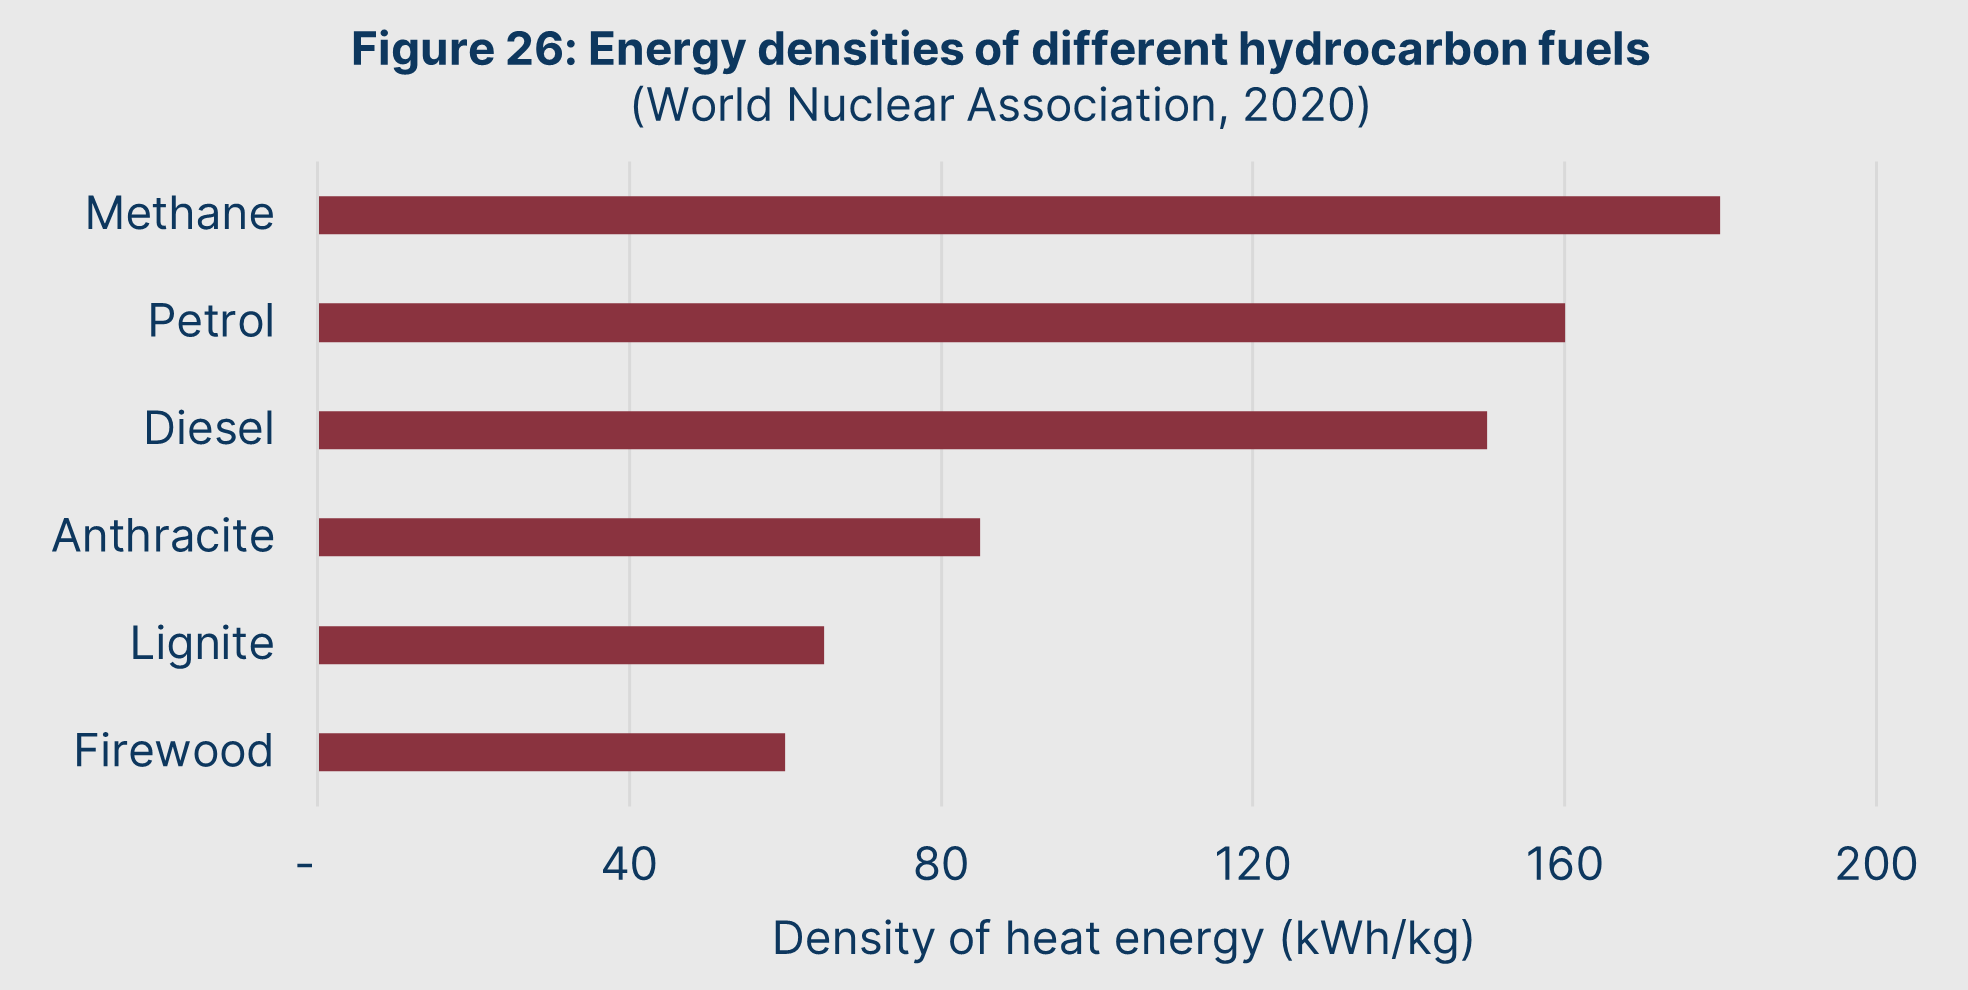
In addition, coal is a solid, which means it must be transported by ship or rail, rather than a pipeline. And, most infamously, it also is more likely to contain impurities that result in pollution when burned.
But these all come together to mean that coal’s total demand is much lower than other hydrocarbons, since it has much more limited use – it is almost exclusively used as fuel for power or a feedstock for industrial processes like steel production. Because of this lower demand, coal is significantly cheaper on a joule-by-joule basis compared to other hydrocarbon energy sources.
That is, a “coal-joule” is much less valuable than a “gas joule”. This is shown in Table 5.
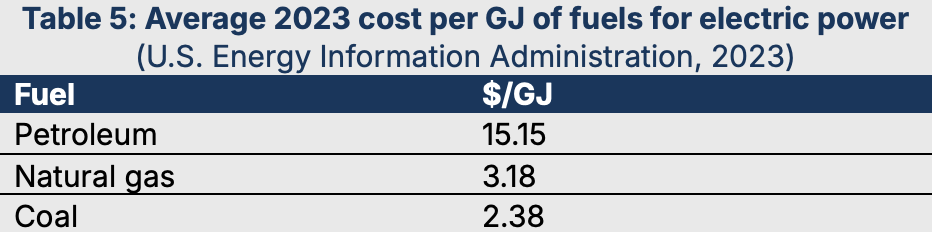
This lower price makes coal a highly appealing fuel source, especially since Britain has some of the most significant coal reserves per capita in the world. Britain enjoys significant reserves of anthracite (“hard coal”) and bituminous coal (“black coal”) – which are significantly cleaner and denser fuels than sub- bituminous coal or lignite (“brown coal”). In fact, Britain’s proven reserves of anthracite and bituminous coal are greater than that of the entire EU combined – 32 billion tonnes versus 27 billion tonnes. (BP, 2021)
Any coal power stations necessarily will initially be fired by coal imports, with main exporting markets being Australia and Indonesia. But by treating energy policy as a part of broader macroeconomic strategy, new generation capacity can provide an ideal buyer for domestic coal once again.
At first this would require Central Energy to buy domestic coal at above market rates, potentially in conjunction with financial assistance through investment or affordable debt facilities. Using modern technology, there is good reason to believe that this new generation of deep mines – and their significant reserves of highly desired anthracite and bituminous coal – could achieve world-leading productivity.
Indeed, before the final death of British coal production in the 2010s, the industry was reporting productivity of 3,200 tonnes extracted per man-year, which was six times more efficient than any contemporary European producer. (UK Coal, 2012)
In the short term, cheap imported coal will reduce national exposure to fluctuations in natural gas prices. In the medium term, cheap domestically produced coal will help do the same. But our ultimate long-term vision for British coal is not as an energy source for power, for reasons to be explored in following sections. Rather, we regard it as a critical industrial input and feedstock, with:
- Anthracite coal being an ideal feedstock for metallurgical processes and to produce carbon-heavy materials such as graphite and graphene.
- Bituminous coal serving as an excellent candidate for conversion into liquid fuel and natural gas through coal liquefaction, significantly increasing the export value of reserves.
PHASE 2:
NUCLEAR RENAISSANCE
With the completion of the grid stabilisation project, a degree of normality will return to the energy system in the short term. However, grid stabilisation is only a mechanism to:
a) Correct for the market distortions brought about through mass intermittent renewable adoption
b) Replace generation capacity that is approaching end of life
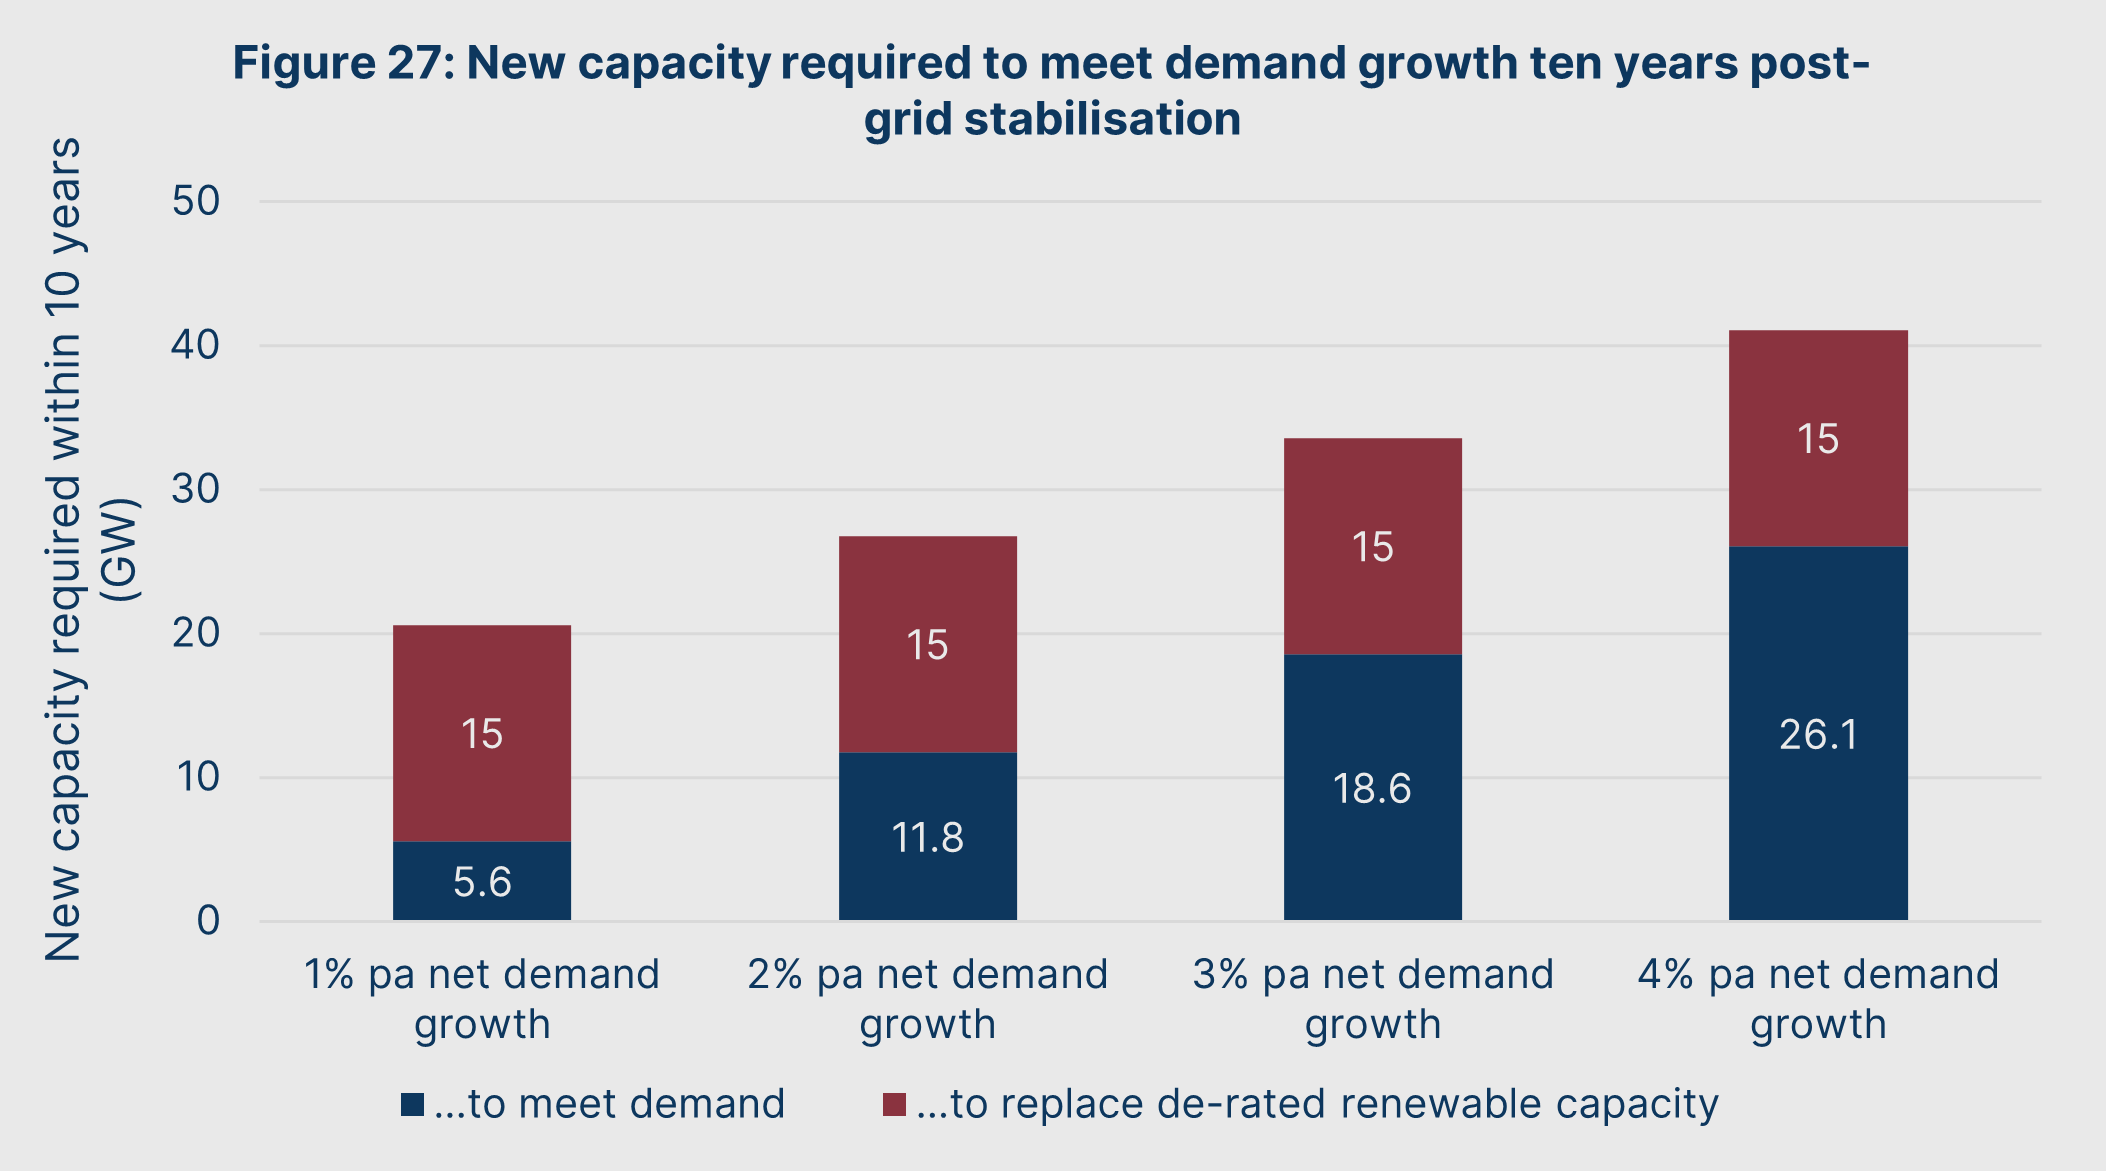
What grid stabilisation is not is a mechanism to anticipate future demand. Assuming grid stabilisation restores pre-2005 energy consumption patterns while also maintaining post-2005 energy efficiency gains, we then create a ten-year forecast for growth in electricity demand. This allows us to see what capacity Central Energy needs to construct now so as to meet future needs.
Using this method, Figure 27 illustrates that up to 26GW of capacity may need to be constructed within the following decade to anticipate future demand. In addition, without extensive subsidies and a demand management regime, we expect that most intermittent renewable projects will no longer prove financially viable and thus will need to be replaced with alternative generation capacity. In total, then, the energy system may require another 40GW of capacity in the decade following grid stabilisation.
While the grid stabilisation initiative will focus on boosting electricity supplied quickly, this new 40GW will focus on improving Britain’s long-term energy abundance. We believe that there is only one generation medium which satisfies this condition: nuclear power.
DISCUSSION 6:
WHY NUCLEAR?
Earlier, we compared the energy density of different hydrocarbon fuels. However, the energy per kilo of nuclear fuel completely eclipses all these energy inputs. This is shown in Figure 28.
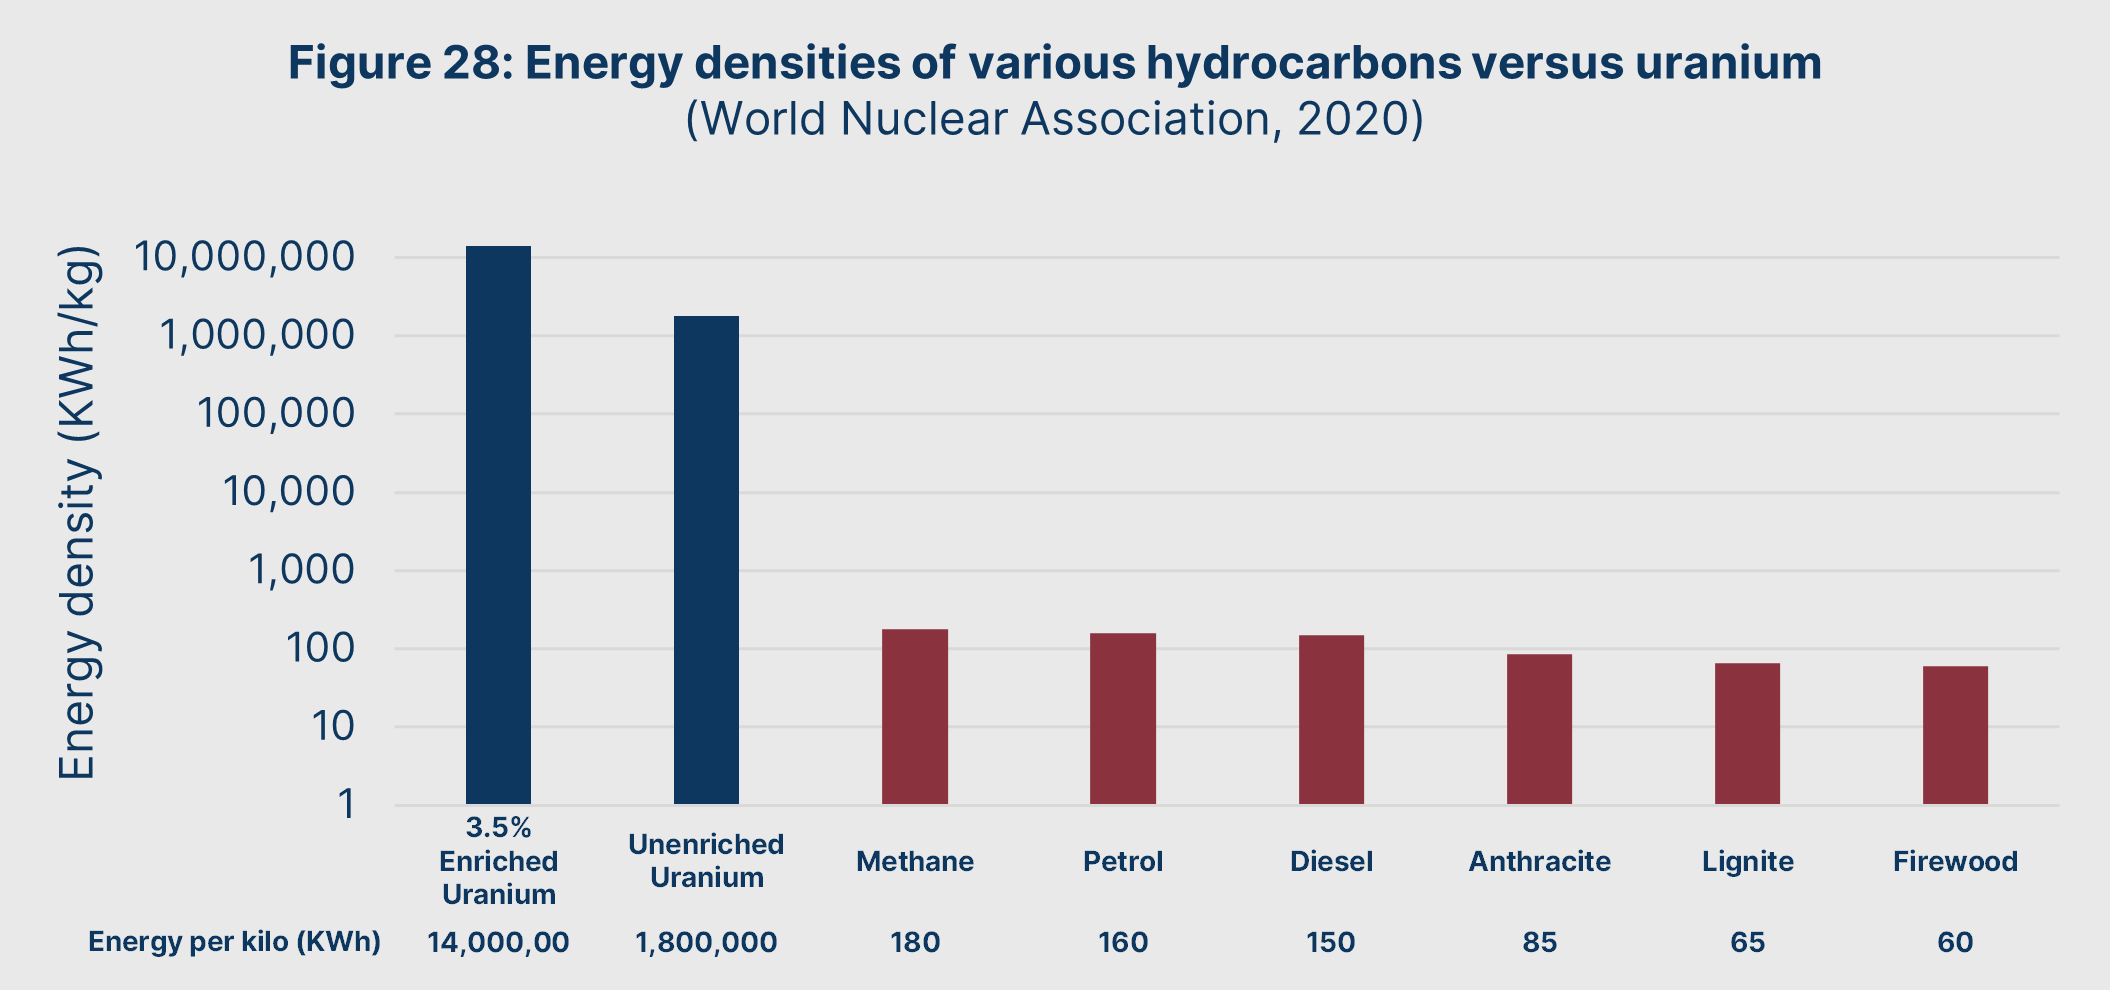
It is this supreme energy density that makes nuclear power so appealing. It is why nuclear power stations enjoy extremely high power density (as shown in Figure 14), since nuclear power stations can install much more efficient storage, logistics, and heat transfer architectures. Further, nuclear plants also enjoy some of the highest possible capacity factors (as shown in Figure 15) because a single fuel cycle contains so much energy content.
Then, there is the elimination of import costs. A single kilogramme of enriched uranium contains 14GWh of energy, meaning that the approximately 500kg of uranium in a fuel assembly would contain 7TWh of energy. Assuming a perfect thermal efficiency in turning this heat into electricity, it quickly becomes obvious that the implications for this are profound in terms of logistics, costs, and energy security:
- To run continuously and constantly for a year, 40GW of nuclear capacity will require at least 350TWh of fuel energy, assuming ideal fuel efficiency.
- With a pessimistic assumption that 10kg of natural uranium is required to produce 1kg of enriched uranium, that means Britain would require only 250 tonnes of imported natural uranium per annum.
- The current long-term price for a tonne of uranium on global markets is $80,000 per tonne. (Cameco, 2025) If we assume the unit cost of enriching raw uranium is three times greater than this, at $240,000 per tonne, then the cost to fuel 40GW of nuclear plants for a year stands at just $80mn
Assuming a £1:$0.8 conversion factor, this means 40GW of nuclear power will costs only £64mn per annum to fuel, with only £16mn being spent on uranium imports. By contrast, the average import cost of natural gas stood at around £34 per MWh in 2023 – assuming this also enjoys perfect thermal efficiency, £11.9bn in gas imports per annum provide an equivalent amount of energy. (Energy Institute, 2025)
This all means that from a fuel perspective, energy from nuclear power stands to be 200 times cheaper than that of natural gas – with most of the fuel cost coming from enrichment, rather than via imports that transfer wealth outside of the nation.
Despite its unassailable advantages, British nuclear power has stagnated and atrophied over the past forty years. This can be seen in its diminishing contribution to total electricity supplied, as illustrated in Figure 29.

Nuclear’s contribution rose markedly and steadily throughout the 1960s, 1970s, and 1980s until ground was broken on Sizewell B in 1988. It was the last nuclear power station to be built in Britain.
All of Britain’s nuclear plants were ordered and constructed under the CEGB. This is not an accident: it was the death of the CEGB which ultimately led to the stagnation of British nuclear. The reason why lies in the question of financing.
The lifetime costs of nuclear power are dominated by the up-front capital costs of a plant, due to the complexity inherent in their design. By contrast, the lifetime costs of hydrocarbon power are dominated by fuel. This is illustrated in Figure 30.
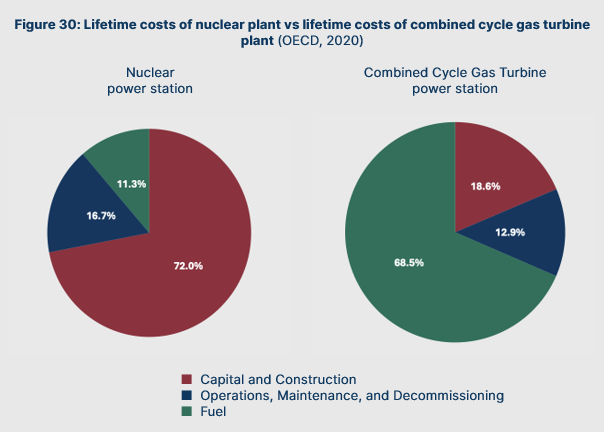
Fuel and operating costs can be funded on a “pay as you go” basis out of plant operations. This is not the case for capital costs – they must be financed by investment or debt. For nuclear power stations, whose costs are dominated by capital and construction, this means that lifetime costs are disproportionately skewed by the cost of capital – such as the annual coupon rate of a bond.
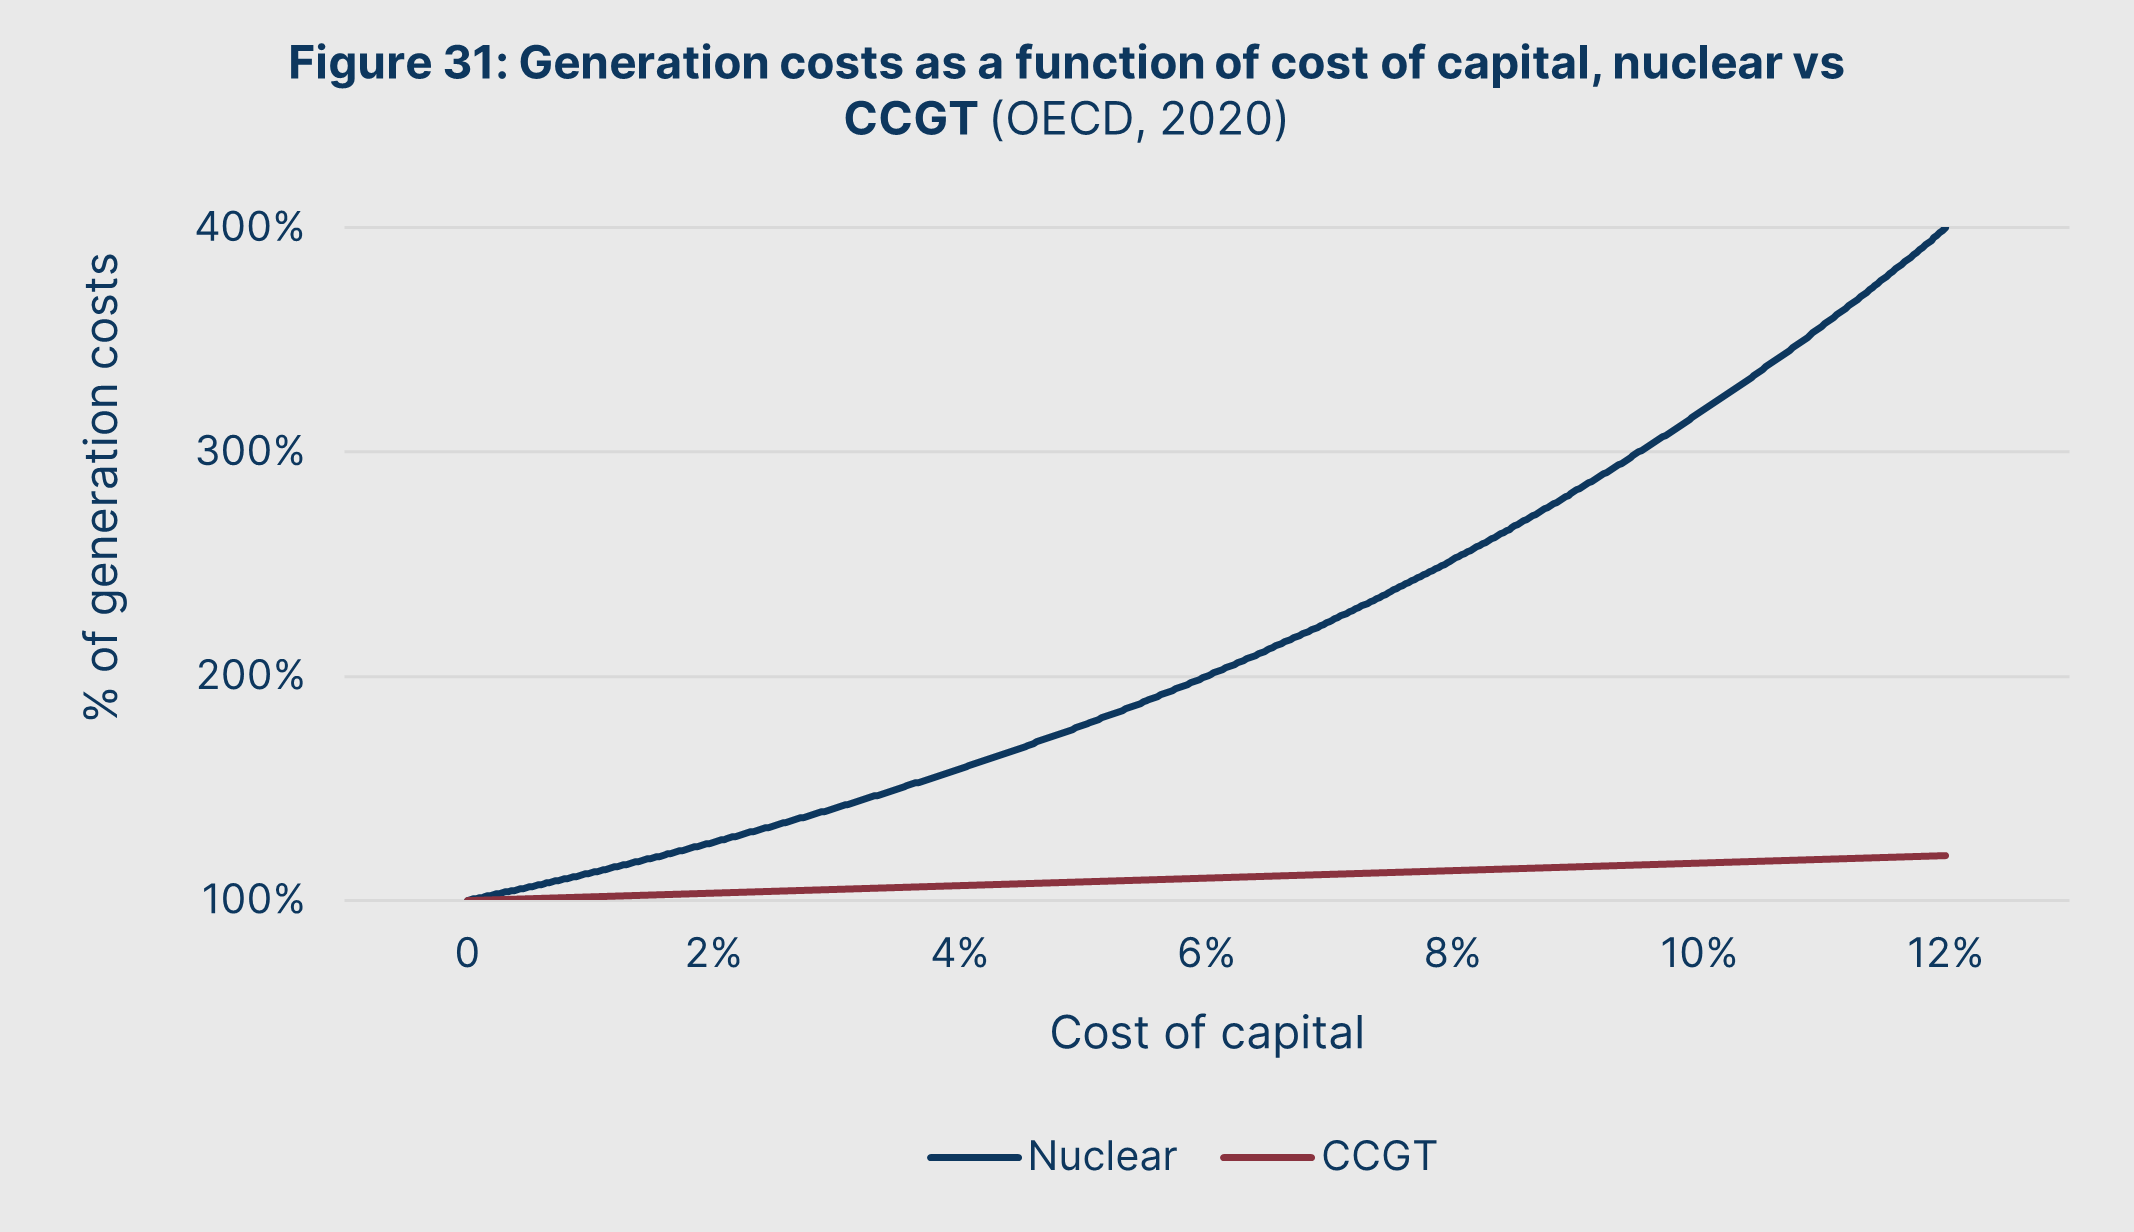
As a result, even small increases in interest demanded radically inflate the total generation costs of nuclear. In an example in Discussion 1, we showed that every 2% hike in the annual coupon rate on a £10bn, 30-year bond increased its lifetime cost by £6bn. This closely reflects the reality facing nuclear plants as shown in Figure 31: a relatively small rise in interest rates causes nuclear’s lifetime costs to multiply, whereas it barely impacts the costs of natural gas.
Before its dismemberment, the CEGB was able to access government bonds for cheap financing. Afterwards, any new nuclear project would require take credit from private markets. The result has been significant cost inflation for any new proposed nuclear projects.
We can see this in the recent debacles of the planned Hinkley Point C or Sizewell C plants. For the latter, the Financial Times (2025) reported total capital costs are estimated to be at least £40bn. With the plant providing 3,260MW of capacity, this suggests that the plant will cost £12.3mn per MW.
By contrast, Sizewell B cost £2.03bn in 1987 prices. (Hansard, 1990) This is £5.85bn in 2025, according to CPI inflation. (ONS, 2025b) With Sizewell B’s nameplate capacity of 1,250MW, this means it inflation-adjusted cost per MW was £4.7mn.
Since the end of the CEGB, private actors have tended towards capital-light generation sources that used cheap fuel, as was seen in the dash for gas. Without cheap government debt, nuclear plants have not been cost-competitive with other generation sources without significant state incentives: which is exactly what has been promised to deliver the Hinkley Point C and Sizewell C projects.
Successive governments have slavishly indulged this dynamic. During the Blair, Brown, and particularly the Coalition Governments, there was an inexplicable refusal to consider any state financing of new nuclear plant – despite the country enjoying some of the lowest interest rates in generations. The opportunity to use sub-1% costs of capital to deliver a generation of ultra-cheap nuclear was squandered, with calamitous results.
Our programme will break from this ruinous course. The new 40GW of nuclear capacity must be fully financed by Central Energy. As was the case during the grid stabilisation project, Central Energy will be given access to government bonds to cover new nuclear plant capital costs.
As was also the case in the grid stabilisation project, Central Energy will be given extraordinary freedoms: the ability to conduct its own planning and environmental audits, be granted immunity to any process of judicial review, and have the power to issue compulsory purchase orders at its discretion. We will instruct Central Energy to use established current-generation reactors that have a proven track record of safety and performance.
We will task Central Energy with actively investigating all nuclear options on the table. This will include comparing efficient gigawatt-scale reactors with newer small modular reactor (SMR) designs. However, we believe that our proposed model of generation – where capacity is financed and owned by the state – eliminates most of the impetus for SMR designs for grid-scale generation, which are predicated on minimising the capital costs of nuclear at the cost of lifetime cost efficiency. Instead, we would sponsor the adoption of SMRs by industry for use in process, with Central Energy investigating options to help British SMR developers like Rolls-Royce develop this opportunity.
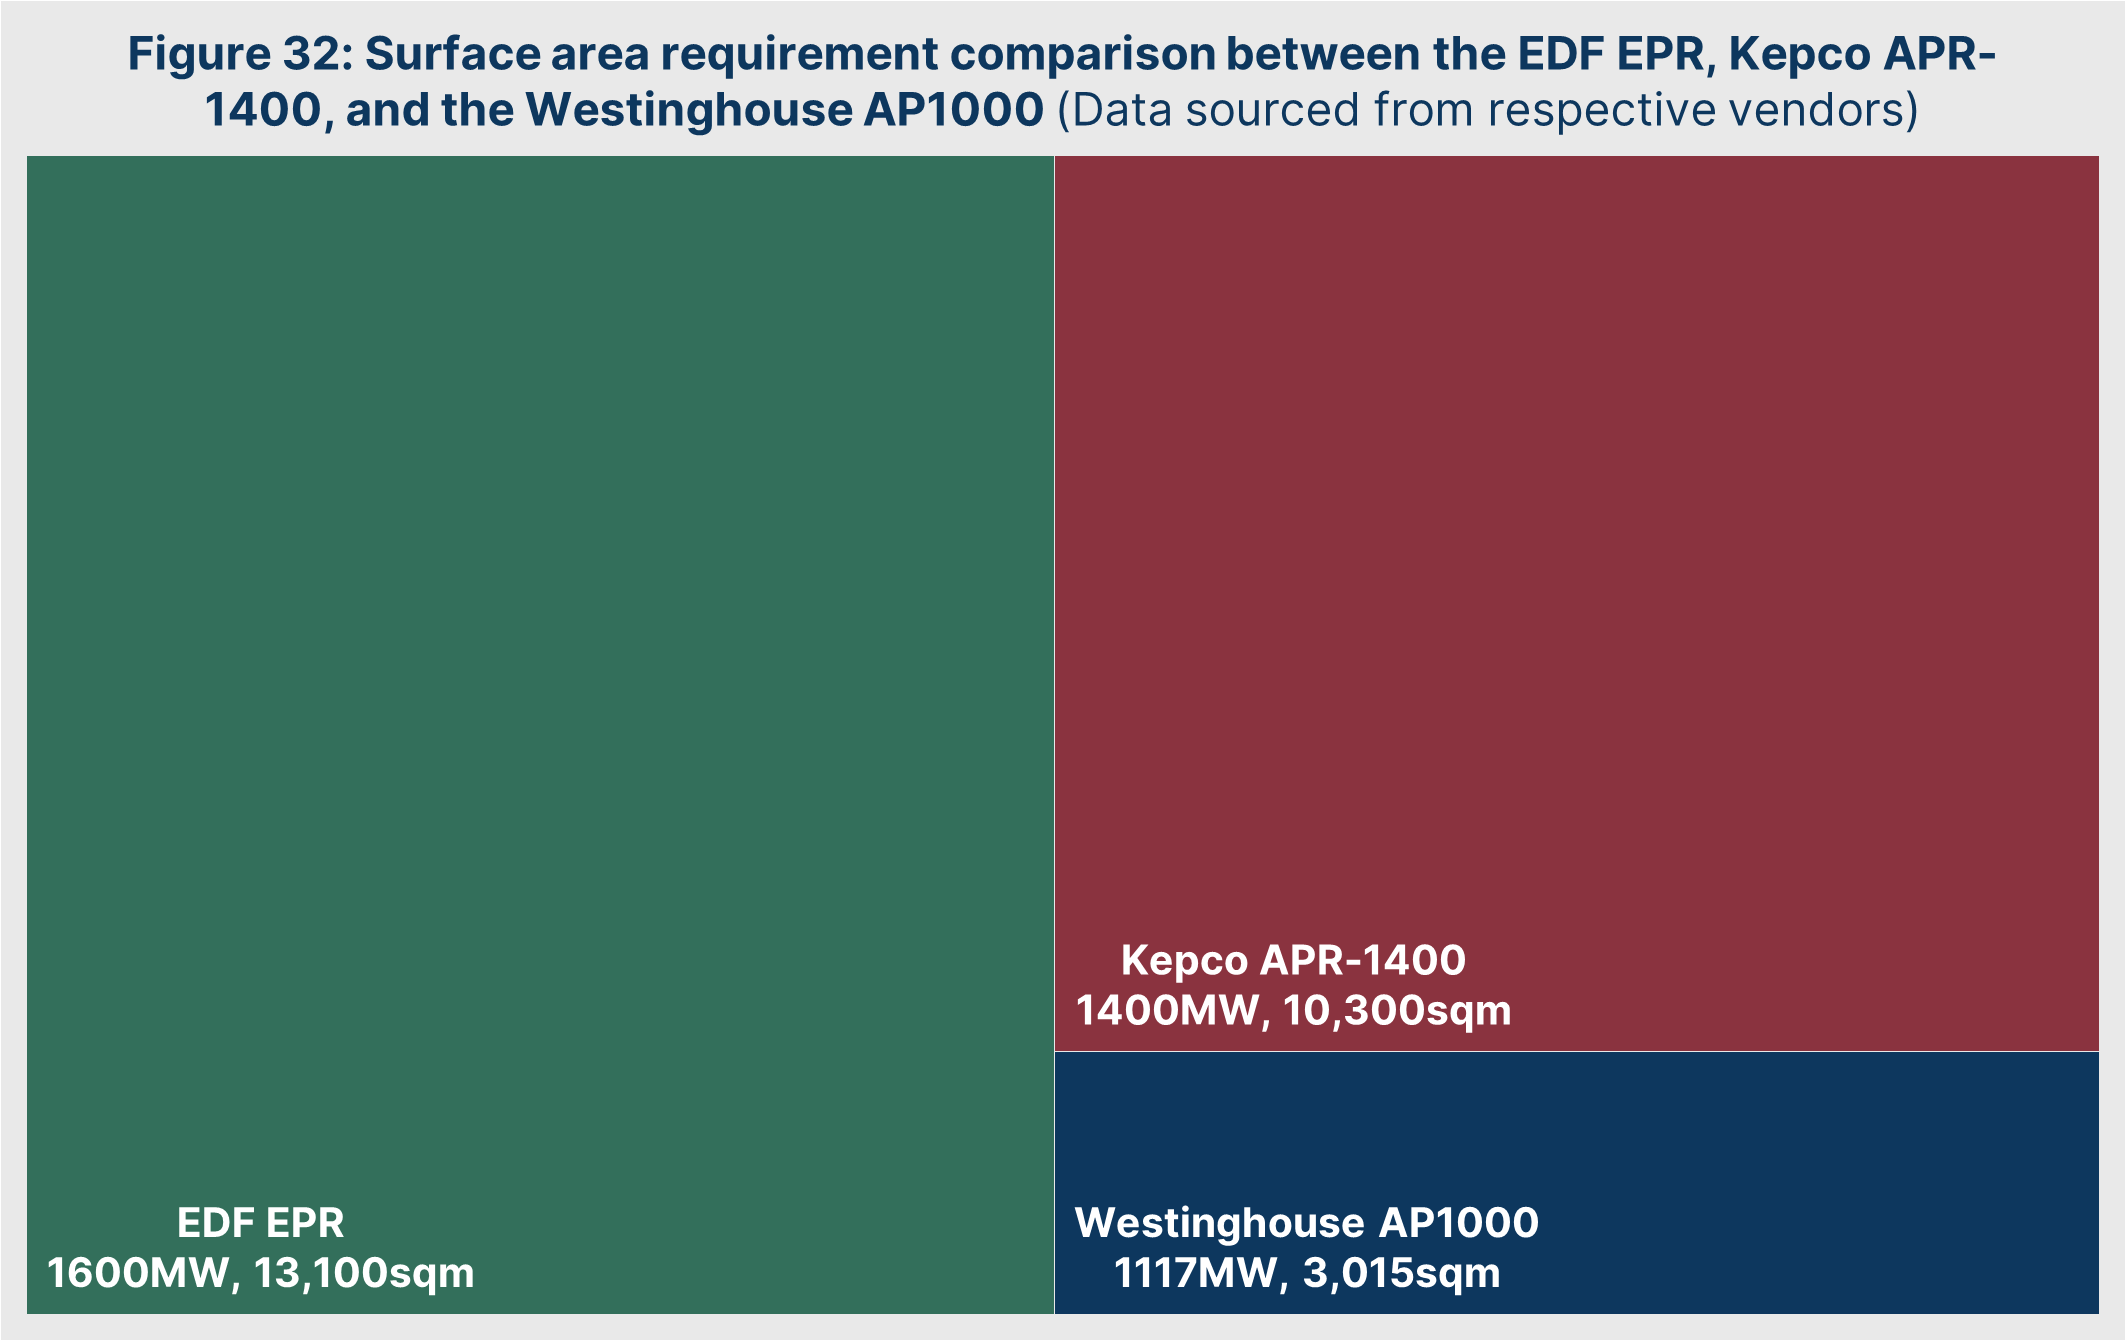
As it stands, we instead believe that the best available design that meets Britain’s requirements is currently Westinghouse’s AP1000 pressurised water reactor. This 1,117MW reactor explicitly designed to limit most of the drivers of nuclear construction complexity and facilitate serial production, while also minimising requirements for concrete, steel, cabling, and piping. In contrast to the European Pressurised Reactor (EPR) used at Hinkley Point C and Sizewell C, the AP1000 also has a very small land footprint and has already built a significant global order book.
Much of the “first-of-its-kind” costs associated with the AP1000 have been covered by the initial reactors of the class constructed in America and China. As a result, it has been estimated that the current capital costs for a new AP1000 will be in the order of $4.3mn per MW of capacity (built over the course of 60 months), reducing over time to $2.9mn per MW (built over the course of 50 months) as the benefits of serial production are realised. (Shirvan, 2022)
Assuming a $1:£0.8 conversion factor, this means that even if capital costs do not significantly fall then the AP1000 will still cost a relatively competitive ~£3.5mn per MW of capacity. For a 40GW fleet of new nuclear reactors, this would entail an up-front capital cost of £140bn. Meanwhile, if costs do fall over time as economies of scale are realised, then the cost per MW would be ~£2.3mn with a capital cost of £92bn for a full 40GW reactor fleet.
Using this information, we can derive the range of costs that will be borne by the state through issuing the funds to Central Energy for this project. Table 6 projects the total costs associated with 30-year bond issuances to finance the new nuclear fleet.
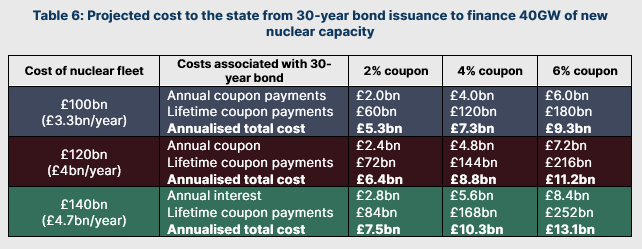
While we believe the AP1000 to be the most promising reactor design currently available based on the abundance of data at hand, we shall defer to the engineers of Central Energy to make the ultimate choice as to the most reliable, economical, and scalable nuclear solution for Britain’s energy system. Ultimately, the task will be to deploy a solution that can be constructed at speed to resurrect British generation capacity – to this end, we accept the need to begin with proven foreign reactor designs delivered on a turnkey basis. However, following the first 40GW of new nuclear capacity, we believe that our nuclear renaissance will give rise to a fresh generation of British nuclear engineering talent who can pioneer a new era of home-grown gigawatt-scale reactors for domestic use and export.
As the initial ten-year plan comes to an end, our grid stabilisation and nuclear renaissance programmes will thus have solved the energy crisis for a generation. But its structural causes – an unplanned system that does not automatically price in macroeconomic considerations – remains. This must be addressed.
DISCUSSION 7:
SAFETY AND DOSAGE
As part of its autonomy, Central Energy will be charged with reviewing the fundamentals of the doctrines around nuclear safety. This includes reviewing the industry’s standards for dosage, such as its current reliance on the Linear No-Threshold (LNT) model of radiation exposure.
LNT is a model which assumes that radiation dosage has a linear relationship with health conditions such as cancer, with no “threshold” level of significantly lower risk at lower dosages. That is, every extra dose of radiation increases the risk of cancer by the same amount.
This conflicts with our increased knowledge today of background radiation exposure we face on a day-to-day basis, which does not strictly correlate to cancer risk a low dose. Instead, the body of evidence increasingly seems to indicate that low-dosage radiation tends to have a significantly lower risk of inducing cancer than suggested by the LNT model, with our cells able to tolerate and repair any damage with minimal disruption.
The dominance of the LNT model, if it is false, could have the effect of encouraging too much risk aversion with regards to the design of nuclear plants. However, because of the political consequences of being seen to be dismissive of safety, generations of political leaders have failed to encourage rigorous review of the LNT paradigm.
As part of its work, Central Energy will be encouraged to fund much-needed basic research definitively to determine key questions related to radiation dosage and health risk. These findings will be used to guide the long-term development of Britain’s fleet of nuclear power stations beyond the immediate capacity demanded of the ten-year plan.
Some consequences of this work may include:
a) Significantly reducing the size of the Detailed Emergency Planning Zone (DEPZ) around a nuclear plant, which currently serves to limit new developments.
b) Allowing greater flexibility in nuclear waste handling and storage.
c) Easier access and links between nuclear power stations and local industrial zones and facilities.
PART 4:
THE ENERGY CREDIT

RATIONALISING ENERGY
Over the course of our ten-year plan, Central Energy will have constructed over 60GW of new hydrocarbon generation capacity alongside also planning for 40GW of new nuclear capacity.
This 100GW of new generation to serve as a “year zero” for a new British energy system.
Without subsidies, financing, or a supportive policy regime, most intermittent renewables will become unsustainable. Central Energy will negotiate reasonable exit agreements with intermittent renewable generators to terminate their Contracts for Difference, and allow these generators to reclaim the scrap value of their now-superfluous capacity.
Beyond intermittent renewables, we expect that most of the country’s remaining privately-owned generating capacity will be approaching end of service life by the end of the ten-year plan. Simply through organic ageing of the energy system, Central Energy will soon emerge as the largest single generator in the entire country.
This is by design. Central Energy’s proximate goal during the ten-year plan was as a vehicle to construct generation swiftly and affordably. But, following this first decade, Central Energy shall begin to resume the old responsibility of the CEGB: as a planning authority for the country’s entire energy system.
In the final years of the ten-year plan, Central Energy will then begin a strategy of market rationalisation and consolidation.
- Through fair – but compulsory – purchases, Central Energy will buy out the small amount of remaining private generation capacity that has a significant remaining lifespan.
- Compulsory purchase orders will be issued against transmission and distribution companies.The compulsory purchase price for each company will be its total net assets on their balance sheet, minus all historic debts deemed to be odious liabilities – that is, the total value of the debt taken on purely to finance bonuses, dividends, or share buybacks.
- Retail electricity suppliers will be notified that Central Energy will no longer be selling its generation to them. This will require suppliers to make a market exit. Central Energy will support such an exit through purchasing their customer accounts and real estate, along with offering their value-producing workers new employment contracts.
After this, Central Energy will be transformed into a national, vertically integrated electricity monopoly.
The post-1990 erosion in British state capacity means that it will take years of concerted effort to build an entity with the flexibility, institutional knowledge, and confidence of the CEGB of old. This must be remedied through proactive organisation building. Pathways for graduate and nongraduate recruitment, internal evaluation and specialisation, and institutional division of labour will be established throughout the ten-year plan.
Central Energy will also partner with academia and universities to guarantee a career pathway for students and researchers, sponsoring the development of undergraduate and graduate curricula for its next generation of employees and leaders. It shall also sponsor retraining and re-employment opportunities for mid-career energy sector employees, ensuring that it benefits from established talent.
This will be necessary as all state organs other than Central Energy will be closed in short order, following the completion of market rationalisation. Ofgem, NESO, of the now-renamed Department of Energy will be wound-up.
In this new system, Central Energy’s most frequent governmental contact will be through the Chancellor of the Exchequer and the Prime Minister. This will primarily be in its planning and coordination function, with Central Energy required to issue the following every year:
- A five-year rolling forecast of future electricity demand.
- A capital plan for generation and transmission that ensures forecast demand will be met.
Central Energy will coordinate with the Treasury and Bank of England in preparing both the above plans. Once subject to Parliamentary scrutiny to ensure a democratic check on the process, the capital plan will then be financed through bond issuance.
By now, Central Energy will have assumed its full role of operational control over the energy system and shall also serve as its planning authority. For the most part, we will have returned to the pre-1990 CEGB.
However, we believe we must go further. The very fact the CEGB was abolished and the energy crisis could occur shows the old system was inadequate.
DISCUSSION 8:
PRODUCTIVITY AND ENERGY
In the first part of this Green Paper, we briefly explored how the energy crisis undermined productivity growth. However, we did not explore why this relationship exists, beyond acknowledging the most obvious cases where such a relationship holds – such as in manufacturing.
To understand this, we must understand what exactly productivity growth is.
After accounting for greater capital stock, economists accept that there are two key components to productivity growth: technological progress, and improvements in human capital. That is, improvements in knowledge or behaviour that allow more effective use of capital and labour.
How exactly does new knowledge and behaviour enable more effective use of capital and labour? After all, knowledge and behaviour’s impact on production is not univariate: it typically changes how labour is organised and how exactly capital is deployed at the same time.
To solve this, many economists now support the idea of a third factor of production. This factor of production is what combines labour and capital,optimises their interaction, and creates value.
We believe that energy is the most convincing candidate for this factor of production. We most obviously see this when it serves as a prerequisite for production, since both labour and capital need energy to work – a human via calories, a robot via electricity.
But, as we have explored earlier in this Green Paper, access to more energy also allows capital and labour to be more productive. Tautologically, transferring energy via motion is work. So, the more energy utilised by a given stock of capital and labour, the more work is literally done by them.
Since energy can neither be created or destroyed, only transferred or transformed, there are two ways labour or capital can increase energy’s contribution to output.
- a) Increase the total amount of energy supplied
- b) Improve the efficiency of energy use
This is an observation that holds up empirically. In a 2003 analysis of historical US economic data, Ayres, Ayres, & Warr demonstrated that the entirety of American productivity growth that was not attributed to capital stock growth can be decomposed into growth in energy supplied, or improvements in output per unit of energy.
LINKING VALUE AND ENERGY
As explored in Discussion 8, we believe energy to be the third factor of production that sits alongside capital and labour. This means output and productivity growth are a function of how much energy we have available, and how effectively we can make use of said energy.
Energy has a critical property as a factor of production: unlike capital and labour, we cannot create or destroy it. Instead, energy can merely be transferred or transformed. This means the price mechanism for electricity is governed by the flow unit of watts (joules per second), rather than the stock unit of joules. When we pay for energy, we pay to enjoy a rate of energy transfer for a given period. We pay for power.
For all factors of production, the goal of the price mechanism should be to ensure supply meets demand. However, since power is a flow measurement, its price mechanism instead serves to determine the amount of time in which a population’s demands can be met. Since we cannot stockpile, discharge, or redistribute time, the energy price thus serves the role of signalling when work can be done, and to what intensity.
In this way, the energy price is the rate limiter for overall economic activity. However, those who control the energy supply may not necessarily wish to grow economic activity in aggregate. Instead, the energy system must be run by a body that continuously and consciously pursues output growth.
For a time, the CEGB achieved this. But because the relationship between output and energy was not codified or established, it was possible to undermine the viability of the energy system by abolishing the CEGB and decoupling the energy system from macroeconomic considerations.
If Central Energy is to avoid this fate, we must do what was not done in the 20th century: recognise that our output and prosperity is a function of energy. This means the price mechanism must do the following things:
- a) encourage the continuous increase in total energy exchanged
- b) encourage improvements in output per unit of energy exchanged
- c) establish a clear and stable relationship between energy and value
To achieve this, following full market rationalisation, we propose that Central Energy institute a permanent nominal price fix on energy of 10p/kWh.
For Central Energy, the maintenance of this relationship while ensuring grid stability will be at the centre of its forecasting and planning duties. This means that it must now work alongside the Bank of England and the Treasury, with energy policy now transformed into a “third lever” of economic management – alongside fiscal and monetary policy.
From that day onwards, £1 will entitle a bearer to 10kWh of electricity discharged from Britain’s grid. We shall dub this new identity relationship the energy credit system.
The energy credit will force the sterling’s integrity to be linked to national energy provision. Markets will thus be able to enforce this system through the mechanisms of the exchange rate and bond yields – credible maintenance of the energy credit will become a necessity for governments, ensuring that there will never be an incentive to repeat the errors of the past.
This system requires that, over the long-term, Britain maintains energy independence. This is because maintaining the nominal peg of the energy credit through any significant amount of energy imports would undermine the stability of the pound. This in turn is because, by design, the system will remove the variable price mechanism that currently reduces demand when wholesale energy prices rise.
If Britain remains a net energy importer, the energy credit system means that any spike in global oil, gas, or interconnector prices will cause a radical increase in the amount of sterling available in global markets – devaluing the currency. By contrast, falls in global oil, gas, or interconnector prices would reduce the amount of new sterling issued to global markets – appreciating the currency.
While the energy credit permits a small energy trade deficit – such as the sub-£50mn cost raw uranium that could run the energy system for a year, as explored in Discussion 6 – it is incompatible with the current regime of gas imports in the order of tens of billions of pounds per annum. In our view, this serves as a benefit to the system: its maintenance will require future governments to take Britain’s energy trade balance seriously.
A NEW ECONOMY
On a day-to-day basis, the energy credit will not represent a significant change to the lives of energy customers. Central Energy will operate customer accounts, regular meter readings shall be used to calculate the customer’s total energy consumption over a period, and they will be charged appropriately. For most consumers, the energy credit will likely serve only as a simple conversion factor: £1 buys 10kWh.
But in the long-term, the energy credit will reshape our economic life. Most profoundly, it will force us to re-couch money and wealth in terms of its ability to enable productive work. The benefits of this will include:
- All economic activity will be expressible in terms of its energy opportunity cost, creating a clear and measurable incentive to minimise energy waste and bolster material efficiency.
- A new way to evaluate value-add for economic activity in the form of return on energy investment, allowing an opportunity to identify the tangible value created by many service and professional firms.
The energy credit system will encourage continuous improvement in energy efficiency and productivity. But as a nominal identity, it will also continuously encourage increased consumption as the real price of energy will continuously fall over time. Since energy use increases the productivity of capital and labour, this guarantees continued productivity growth across the economy.
The energy credit is particularly attractive for manufacturing and energy-intensive industries, as it reduces uncertainty regarding the long-term operating costs for enterprises. This reduction in uncertainty means less risk for lenders and investors in new enterprises, which in turn will reduce the cost of capital for manufacturing activity. This, in turn, will encourage the reallocation of capital towards these enterprises – and since manufacturing and energy-intensive industries enjoy a significantly higher gross value add than the national average, the energy credit will thus raise national output and productivity.
Additionally, the energy credit will grant the government significant new tools in monetary policy. The first is through Central Energy’s ability to help control the money supply, along with the traditional tools of monetary policy:
- If the economy is entering a deflationary period, Central Energy can increase the money supply by simply adding credit to customer accounts and “freeing up” bills to be spent on consumption.
- If the economy is entering an inflationary period, Central Energy can decrease the money supply by encouraging customers to front-load energy spending by offering bonus kWhs for every pound debited to their account.
This same mechanism can also be used to stimulate economic activity when offered just to industrial customers, encouraging them to temporarily increase production. Secondly, the energy credit will provide a source of information to better manage the economy over the medium- to long-run. If the rate of inflation is such that Central Energy risks being overwhelmed through demand growth in its five-year projections, then interest rates can be increased early and appropriately to ensure the energy system’s integrity. This allows the nation’s money and balance sheet to track its productive capacity, rather than its speculative value.
The result is a virtuous, self-sustaining system that guarantees macroeconomic stability and continuously improves our productive capacity. It marks a shift towards a new economy: one where wealth and value are true measures of material abundance. And one in which gains in energy efficiency and productivity go hand in hand, to the benefit of the UK’s economy and its environment.”
CONCLUSION
In this Green Paper, we have argued that we have suffered under a ruinous energy crisis for the past twenty years. This arose because we abandoned our desire and capacity to plan and coordinate our energy system, leaving it vulnerable to distortions such as an unrealistic push for reliance on intermittent renewables. To facilitate this unviable new generation base, an indirect form of rationing emerged to suppress energy demand via rising non-wholesale cost components of energy bills.
We have presented a ten-year plan to reverse this situation. A new body named Central Energy will be charged with overseeing the following:
- The construction of 40GW of new natural gas power stations and 20GW of new coal power stations.
- The construction of 40GW of new nuclear power stations.
In conjunction with these, the extraction of oil, gas, and coal will be liberalised to increase the supply of fuel and reduce wholesale energy costs.
After the completion of the ten-year plan, the full energy system will then be rationalised. Central Energy will become the nation’s single vertically integrated body responsible for energy generation, transmission, distribution, and sale.
This, in turn, will enable us to create a new system that guarantees long-term price stability, productivity growth, and better macroeconomic management by the state. This will come in the form of a new economic order which codifies the link between value and energy through a permanent nominal price peg of 10p/kWh, a system we have dubbed the energy credit.
It has been noted by many that there exist no rich, energy-poor nations. As we have argued, that is because energy – or, more accurately, a continuous turnover of energy – is a prerequisite to all value. It is at the heart of anything that we may call societal progress.
In this Green Paper, we have shown why the attempt to break this relationship has proven so disastrous. And we have shown how we can create a new system that instead guarantees perpetual growth and abundance.
OUR TEN-YEAR PLAN
STEP 1
BUILD 40GW OF NATURAL GAS POWER STATIONS, AND 20GW OF COAL
STEP 2
BUILD 40GW OF NUCLEAR POWER STATIONS
STEP 3
FIX THE PRICE OF ELECTRICITY TO 10p PER KWH
REFERENCES
André, C., Costa, H., Demmou, L., & Franco, G. (2023, May 11). Rising energy prices and productivity: short-run pain, long-term gain?. Retrieved from Organisation for Economic Co-operation and Development: https://doi.org/10.1787/2ce493f0-en
Ayres, R. U., Ayres, L. W., & Warr, B. (2003). Exergy, power and work in the US economy, 1900–1998. Energy, 28(3), 219-273. https://doi.org/10.1016/S0360-5442(02)00089-0
Bank of England. (2024, August). A millennium of macroeconomic data. Retrieved from https://www.bankofengland.co.uk/-/media/boe/files/statistics/research-datasets/a-millennium-of-macroeconomic-data-for-the-uk.xlsx
BP. (2021). Statistical Review of World Energy, 70th Edition. Retrieved from https://www.bp.com/content/dam/bp/business-sites/en/global/corporate/pdfs/energy-economics/statistical-review/bp-stats-review-2021-coal.pdf
British Broadcasting Corporation. (1992, October 13). Thousands of miners to lose their jobs. Retrieved from BBC News: http://news.bbc.co.uk/onthisday/hi/dates/stories/october/13/newsid_2532000/2532765.stm
Cameco. (2025, June). Uranium Price. Retrieved from https://www.cameco.com/invest/markets/uranium-price
Cleveland, C. (2024, May 13). Average annual capacity factors for electricity generation in the United States in 2022. Retrieved from https://visualizingenergy.org/what-are-capacity-factors-and-why-are-they-important/
Climate Change Committee. (2025, February 26). The Seventh Carbon Budget. Retrieved from https://www.theccc.org.uk/publication/the-seventh-carbon-budget/
Copernicus Climate Change Service; World Meteorological Organization. (2025). European State of the Climate 2024. Retrieved from https://climate.copernicus.eu/ESOTC/2024
Department for Energy Security and Net Zero. (2024a, July 30). Historical electricity data: 1920 to 2023. Retrieved from https://www.gov.uk/government/statistical-data-sets/historical-electricity-data
Department for Energy Security and Net Zero. (2024b, July 30). Digest of UK Energy Statistics (DUKES). Retrieved from https://www.gov.uk/government/collections/digest-of-uk-energy-statistics-dukes
Department for Energy Security & Net Zero. (2025a, March 27). Gas and electricity prices in the non-domestic sector. Retrieved from https://www.gov.uk/government/statistical-data-sets/gas-and-electricity-prices-in-the-non-domestic-sector
Department for Energy Security and Net Zero. (2025b, June 26). Energy Trends: June 2025. Retrieved from https://www.gov.uk/government/statistics/energy-trends-june-2025
Downing, A. (2024, January 27). How did Britain pay for the last ‘Great Grid Upgrade’? Retrieved from Who kept the lights on?: https://energynetworks.substack.com/p/how-did-britain-pay-for-the-last
Downing, A. (2025, June 25). The myth of the central planner. Retrieved from Who kept the lights on?: https://substack.com/home/post/p-166755996
Energy and Climate Change Committee. (2015, February 10). Energy network costs: transparent and fair? Retrieved from House of Commons: https://publications.parliament.uk/pa/cm201415/cmselect/cmenergy/386/38604.html
Energy Institute. (2025, 06 26). 2025 Statistical Review of World Energy. Retrieved from https://www.energyinst.org/statistical-review
Energy Voice. (2023, March 19). 10 North Sea fields nearing govt approval found over 30 years ago on average. Retrieved from https://www.energyvoice.com/oilandgas/exploration-production-ep/493003/10-north-sea-fields-nearing-govt-approval-found-over-30-years-ago-on-average/
Eurocoal. (2025). United Kingdom. Retrieved from https://euracoal.eu/library/archive/united-kingdom-6/
European Environment Agency. (2024, September 20). Emission trends of sulphur oxides. Retrieved from https://www.eea.europa.eu/en/analysis/maps-and-charts/emission-trends-of-sulphur-oxides
Financial Times. (2025, Jan 14). Cost of Sizewell C nuclear project expected to reach close to £40bn. Retrieved from Financial Times: https://www.ft.com/content/0b483728-de5b-4f2e-8d00-c49885c572c9
Global Carbon Budget. (2024, November 2024). Fossil fuel CO2 emissions increase again in 2024. Retrieved from https://globalcarbonbudget.org/fossil-fuel-co2-emissions-increase-again-in-2024/
Global Energy Monitor. (2025, January). Global Oil and Gas Plant Tracker. Retrieved from https://globalenergymonitor.org/projects/global-oil-gas-plant-tracker/
Helm, D. (2019, February 12). The Systems Regulation Model. Retrieved from https://dieterhelm.co.uk/wp-content/uploads/assets/secure/documents/XFN-The-Systems-Regulation-Model-12.02.19.pdf
International Atomic Energy Agency. (2006). Economic Performance Indicators for Nuclear Power Plants. Retrieved from https://www-pub.iaea.org/MTCD/Publications/PDF/TRS437_web.pdf
Littlechild, S., & Vaidya, K. (1982). Energy Strategies for the UK. Oxford: Routledge.
Manning, A., & Hughes, S. (2025, February). Debt to society: what the network companies should do with their windfall profits. Retrieved from The National Association of Citizens Advice Bureaux: https://assets.ctfassets.net/mfz4nbgura3g/50vEwp7WgCIY0oB4hCYKuG/31a3facc46b352ee3b74cc9680c07ed1/Debt_to_society__2_.pdf
Ministry of Housing, Communities and Local Government. (2025, January 30). English Housing Survey 2023 to 2024: headline findings on housing quality and energy efficiency. Retrieved from https://www.gov.uk/government/collections/english-housing-survey-2023-to-2024-headline-findings-on-housing-quality-and-energy-efficiency
National Energy System Operator. (2025, July). Future Energy Scenarios: Path to Net Zero. Retrieved from https://www.neso.energy/document/364541/download
Nøland, J. K., Auxepaules, J., Rousset, A., Perney, B., & Falletti, G. (2022). Spatial energy density of large-scale electricity generation from power sources worldwide. Scientific Reports, 12. https://doi.org/10.1038/s41598-022-25341-9
Office for National Statistics. (2025a, May 19). The impact of higher energy costs on UK businesses: 2021 to 2024. Retrieved from https://www.ons.gov.uk/economy/economicoutputandproductivity/output/articles/theimpactofhigherenergycostsonukbusinesses/2021to2024
Office for National Statistics. (2025b, June 18). Consumer price inflation time series. Retrieved from https://www.ons.gov.uk/economy/inflationandpriceindices/timeseries/l55o/mm23
Office for National Statistics. (2025c, May 15). Output per hour worked % change per annum. Retrieved from https://www.ons.gov.uk/employmentandlabourmarket/peopleinwork/labourproductivity/timeseries/lzvd/prdy
Office for National Statistics. (2025d, May 15). GDP first quarterly estimate time series. Retrieved from https://www.ons.gov.uk/economy/grossdomesticproductgdp/timeseries/abmi/pn2
Offshore Energies UK. (2025, March). Business Outlook Report. Retrieved from https://oeuk.org.uk/product/business-outlook-report-2025/
Ofgem. (2009, February 27). Regulating Energy Networks for the Future: RPI-X@20. Retrieved from Ofgem: https://www.ofgem.gov.uk/sites/default/files/docs/2009/02/supporting-paper—history-of-energy-network-regulation-final.pdf
Ofgem. (2025, May 23). Energy price cap levels Pre-levelised rates model. Retrieved from https://www.ofgem.gov.uk/energy-policy-and-regulation/policy-and-regulatory-programmes/energy-price-cap-default-tariff-policy/energy-price-cap-default-tariff-levels
Organisation for Economic Co-Operation and Development. (2020). Unlocking Reductions in the Construction Costs of Nuclear. Retrieved from https://www.oecd-nea.org/upload/docs/application/pdf/2020-07/7530-reducing-cost-nuclear-construction.pdf
Our World in Data. (2025, January 24). Energy use per person vs. GDP per capita, 2023. Retrieved from https://ourworldindata.org/grapher/energy-use-per-person-vs-gdp-per-capita
Parsons Brinckerhoff. (2011, August 5). Electricity Generation Cost Model – 2011 Update Revision 1. Retrieved from https://www.globalccsinstitute.com/archive/hub/publications/46711/deccparsonsbrinkerhoff2011.pdf
S&P Global (2025, March 25). UK conditions for North Sea oil and gas eroding output potential. Retrieved from: https://www.spglobal.com/commodity-insights/en/news-research/latest-news/crude-oil/032525-uk-conditions-for-north-sea-oil-and-gas-eroding-output-potential-oeuk
Shirvan, K. (2022, March). Overnight Capital Cost of the Next AP1000. Retrieved from https://web.mit.edu/kshirvan/www/research/ANP193%20TR%20CANES.pdf
Siemens Energy. (2018). The Egypt Megaproject. Retrieved from https://assets.new.siemens.com/siemens/assets/api/uuid:38ad89c9f4532436a921ed151da1d987a985deec/siemens-egypt-megaproject.pdf
The Independent. (2025, February 14). Huge gas field found under Lincolnshire ‘could fuel UK for decade’. Retrieved from https://www.independent.co.uk/news/uk/home-news/gas-field-lincolnshire-uk-fracking-net-zero-b2698167.html
Thompson, J. (2025, March 14). GB capacity market T-4 auction: results review. Retrieved from Montel: https://montel.energy/resources/blog/gb-capacity-market-t-4-auction-results-review
Tong, D., Farnham, D. J., Duan, L., Zhang, Q., Lewis, N. S., Caldeira, K., & Davis, S. J. (2021). Geophysical constraints on the reliability of solar and wind power worldwide. nature communications, 12. https://doi.org/10.1038/s41467-021-26355-z
Tovey, K. (2017, April 24). The changing price of wholesale UK electricity over more than a decade. Retrieved from Institution of Civil Engineers: https://www.ice.org.uk/areas-of-interest/energy/the-changing-price-of-wholesale-uk-electricity-over-more-than-a-decade
Turver, D. (2025, May 18). Renewables are More Expensive than Gas. Retrieved from Eigen Values: https://davidturver.substack.com/p/renewables-are-more-expensive-than-gas
U.S. Energy Information Administration. (2023). Weighted Average Cost of Fossil Fuels for the Electric Power Industry, 2013 through 2023. Retrieved from https://www.eia.gov/electricity/annual/html/epa_07_04.html
UK Coal. (2012). Coal In Britain Today. Retrieved from https://web.archive.org/web/20120414095101/http://www.ukcoal.com/coal-in-britain
World Nuclear Association. (2020, November 18). Heat Values of Various Fuels. Retrieved from https://world-nuclear.org/information-library/facts-and-figures/heat-values-of-various-fuels
