In November 2021, the SDP launched “The End of Indifference”. This seminal green paper on economics and industry shows why and how Britain must call time on four decades of debt and decline.
CONTENTS
The Social Democratic Party offers its warmest thanks to the authors of this paper –
Michael J. Taylor and Matthew Kirtley.
FOREWORD
Debt-fuelled consumption is not prosperity.
The claim made in this Green Paper – that our debt-driven economic order is unstable, harms prosperity and causes beggary – is epochal. Its consequences are revolutionary.
To say that neoliberal economics has worked is to deny reality. The data shows that for the past forty years, economic growth and private sector profits in the UK have mainly come from plundering the assets and wealth of society and the state. Long-term social prosperity has been sacrificed for short-term private gain. The ultimate cause of this has been a set of ideas rooted in a species of liberalism which amounts to indifference.
We have become indifferent to what is made where and by whom; to the loss of secure employment; to huge regional divides; to persistent trade deficits and relentless de-industrialisation and to the attachment citizens have to their localities and nation.
This type of economic indifference has coincided with equivalent apathy in the social sphere. Those that govern us show indifference to the steady disintegration of the family; to the need to secure homes for young people wishing to raise children in safe communities; to rising levels of ill-health, obesity and drug dependence. In the political arena we had – until recently – even become indifferent to who, ultimately, governs us and whether we can remove them from power.
Thankfully, the liberals of various types who’ve been in charge for a generation are finding themselves on the wrong side of history.
The age of indifference is closing – and not before time.
William Clouston
Party Leader
Social Democratic Party
EXECUTIVE
SUMMARY
Over the past forty years, Britain’s profit model has degenerated. Rather than economic growth and profits coming from businesses producing more value, they now come from the public and the government spending more than they earn. This broken profit model lowers incomes, fosters inequality and destroys the wealth of all but a few. It cannot be allowed to continue.
To exit this model, we propose a programme which pursues the following four targets: reducing dissaving, raising investment, resetting the balance of trade, and conserving natural capital.
To reduce dissaving, the government must:
1. Mandate the Bank of England to guarantee that household debt rises no faster than median household income.
2. Impose a moratorium on buy-to-let mortgages.
3. Prevent the Bank of England from setting the base rate below the natural rate of interest.
To raise investment, the government must:
4. Limit net migration to 50,000 per year.
5. Apply a modifier to a company’s corporation tax burden, reflecting the median amount of time employees spend with the company.
6. Target R&D investment to grow to 4% of GDP.
To reset the trade balance, the government must:
7. Set a targeted goods trade deficit of 3% of GDP.
8. Target a competitive exchange rate of 1:1 sterling-dollar parity.
And to conserve natural capital, the government must:
9. Invest £4 billion more per year in next generation energy and emissions technologies.
10. Create new “circular economy” Special Economic Zones with distinct tax and regulatory regimes.
These ten proposals are to form the first steps of a new economic model, which will see growth and profit cease to come from undermining our future wealth – the effective plundering of the prosperity of the people and the state.
Under our proposed new economic model, growth and profits would be the result of a tangible and sustainable expansion of the industrial base. The result would be a society which is wealthier, more just, and can guarantee the prosperity of future generations.
BRITAIN’S
PROFIT
MODEL
In 1954, the Polish economist Michał Kalecki demonstrated that the total profits of all companies within a society must equal their savings. Kalecki then showed that changes to this corporate profit must equal movements in the savings made by all other parts of the economy. To capture these findings, Kalecki summarised them with the following equation:
CORPORATE PROFIT
=
NET INVESTMENT
—
HOUSEHOLD SAVINGS
—
GOVERNMENT SAVINGS
+
TRADE SURPLUS
Kalecki, 1954
This mathematical identity – the Kalecki profit equation – allows us to calculate the rate of corporate profits across a society, and to discover the extent to which profits come from investment, government borrowing, household borrowing or exports.
Using data from the national accounts, we can use the profit equation to see how Britain’s corporate profits have changed over time. On calculating this, we find that since the Second World War corporate profit has mostly come from:
- net investment (investment in new property, plant, and equipment), and
- dissaving by governments and households (ie, spending being greater than income)
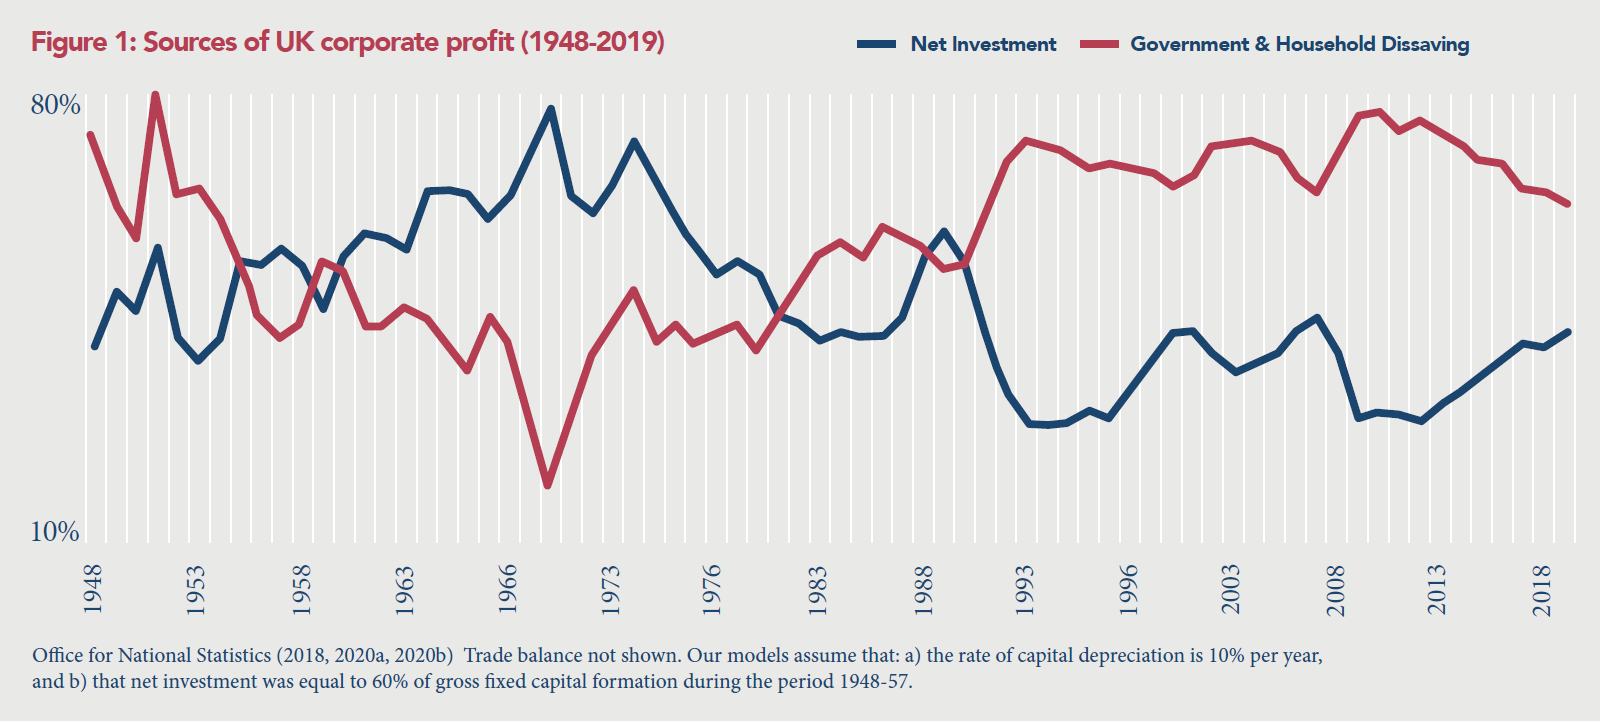
Figure 1 shows that there have been two distinct periods of corporate profit generation since the Second World War:
1948 – 1980: This period saw net investment trend upwards and become the dominant source of corporate profit, with an average share of 56.7%. This meant that corporate profits and growth were mostly driven by investment into new capital goods (such as property, plant, and equipment), which in turn could be used to create more economic output. We will call this arrangement the investment-driven model of profit and growth.
1981 – present: This period has seen dissaving trend upwards and become the dominant source of corporate profit, with an average share of 65.9%.
This means that corporate profits and growth were mostly driven by a combination of households and governments spending more than their incomes on goods and services. We will call this arrangement the dissaving-driven model of profit and growth.
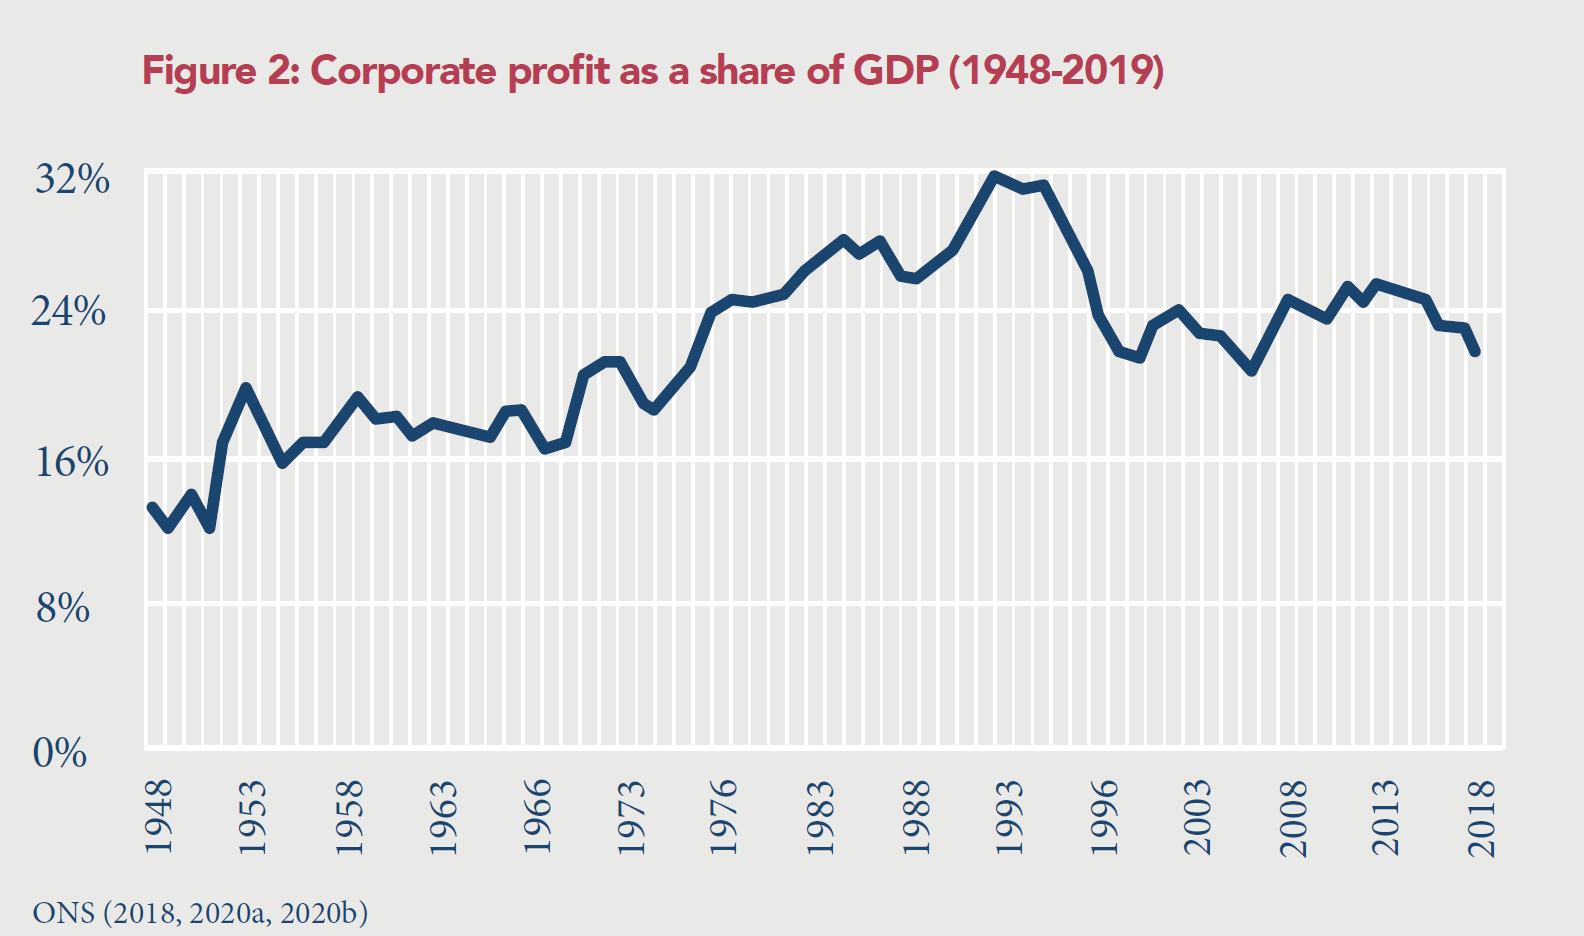
As illustrated in Figure 2, the ascendency of the dissaving-driven model has been a great boon for the corporate sector. From 1948 until 1980 corporate profits averaged 18.9% of GDP, whereas between 1981 to 2019 they averaged 25.5% of GDP (ONS, 2018, 2020a, 2020b).
However, by contrast, the dissaving-driven model has performed poorly at improving economic output. While per capita GDP grew at just under 3% per annum between 1950-80, it has grown by just under half that since then. (Gudgin, 2018).
Ultimately, while the corporate sector has prospered under the dissaving-driven model, the rest of society has not. This is because the dissaving-driven model brings with it two major problems.
The first problem with the dissaving-driven model is that the reduction it brings in net investment reduces productivity growth, since net investment is what provides workers with new capital goods to grow their output. A fall in productivity growth means a fall in real wage growth, since wages are a function of the output of workers.
As a result the incomes of wage-earners will grow more slowly – at worst, they may stagnate or fall as inflation erodes their spending power.
Sadly, wage stagnation has indeed been a reality for most workers in recent decades, with median posttax earnings falling by 1% in real terms between 2010 and 2018 (Panjwani & Reland, 2019).
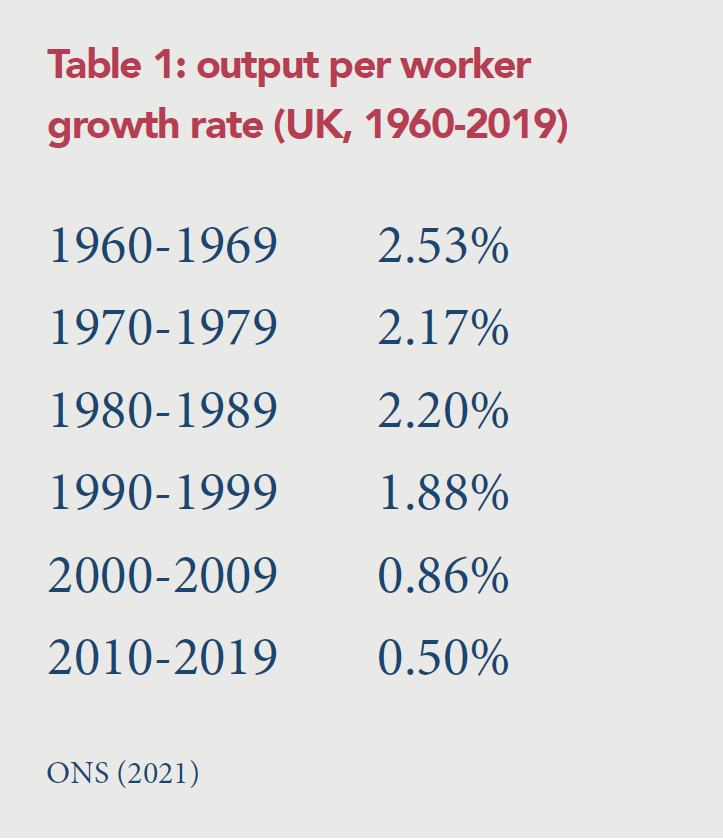
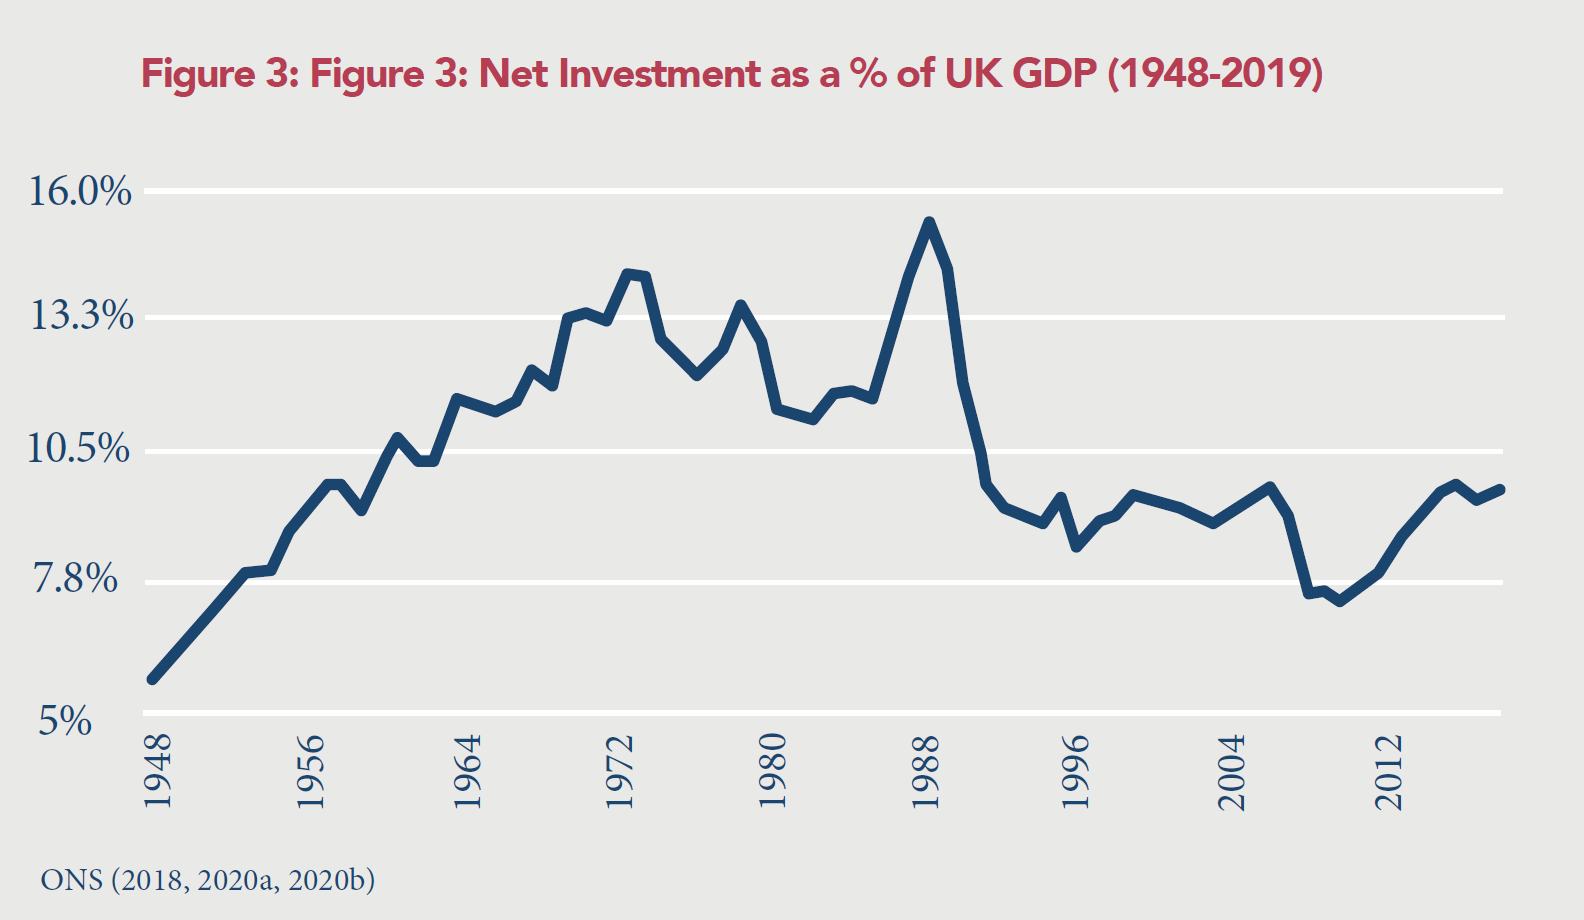
This can be traced back to flatlined productivity growth – which, as shown in Table 1, began to fall in the 1990s. This productivity collapse can be tied to a sharp fall in net investment at the start of the decade, as shown in Figure 3.
The second problem with the dissaving-driven model is that it erodes non-corporate wealth in an economy.
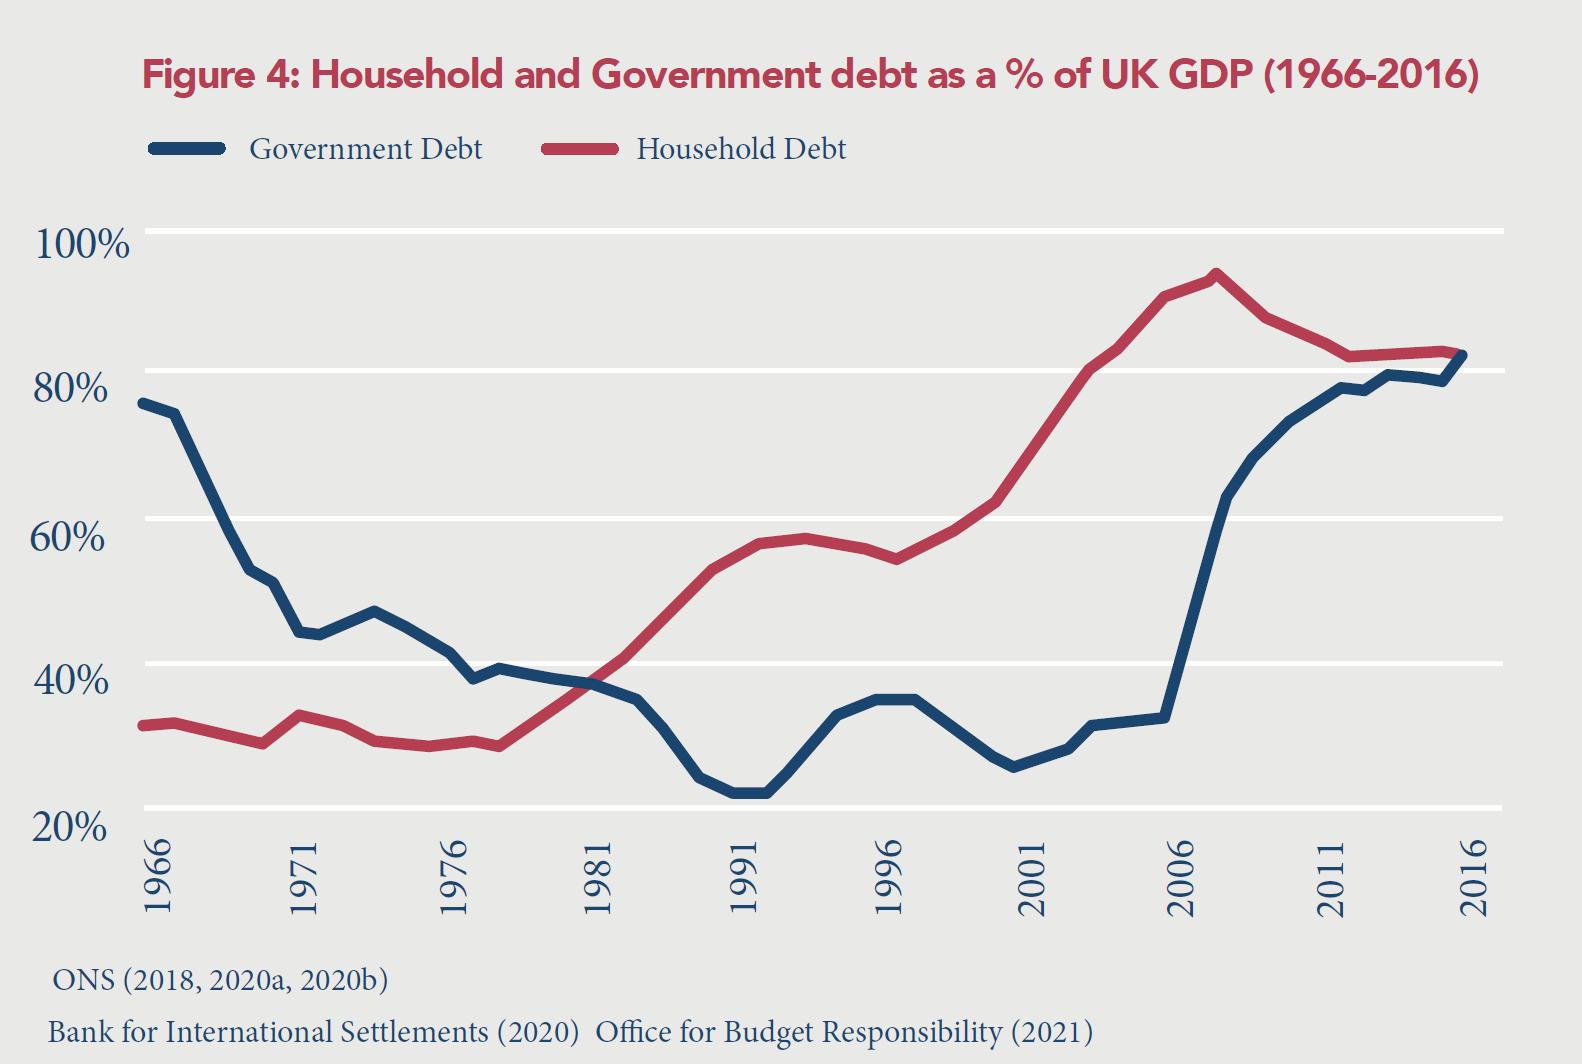
This is because households must find ways to finance the continual deficits demanded by the dissaving-driven model, which means that they must deplete their savings, liquidate their assets, or take on debt. As shown in Figure 4, the final option has proven to be wildly popular among consumers, with the total credit held by households exploding from 29.8% of GDP in 1980 to 84% of GDP in 2019. Government debt has also ballooned, the main driver of this growth being its indirect taking on of consumer debt via bank bailouts in the late 2000s.
The long-run consequences of households forgoing savings and continually taking on debt are bleak. Since corporate profitability now depends on the household sector’s ability and willingness to take on more debt, the dissaving-driven model encourages low interest rates to maintain borrowing and the economic status quo. These depressed interest rates reduce remaining incentives to save and can eventually destroy existing savings via negative real interest rates. This encourages wealthy households to shift savings into assets – such as property and shares.
The additional demand for assets, combined with easier access to credit, causes the value of assets such as housing to unsustainably balloon, further dissolving the wealth of the rest of the household sector through higher rents, mortgages, and deposits. What featherbeds the wealthy beggars the rest of society.
REBALANCING
THE EQUATION
In short, Britain’s economic model since 1980 has:
a) Pushed down earnings through strangling productivity
b) Indebted and eroded the wealth of households outside the corporate sector
c) Encouraged asset price bubbles, which induce cycles of “boom and bust”
Instead of creating and generating prosperity, our economic structure instead entails the long-term beggary of the household sector and the government. It runs utterly contrary to the idea of a sustainable and sane economic system.
There is nothing ‘natural’ or ‘inevitable’ about this model. It is a distortion of recent origin, which started in the 1980s and intensified dramatically after that. Thankfully, this means it can be dealt with through a policy framework which consciously seeks to rebalance the profit equation through rewarding investment and limiting further debtbased beggary.
This will take time: the distortion of our current incentives has taken decades to fully reveal itself, and the reset will take time to produce results. However, it is both possible and necessary.
Through rebalancing the profit equation, we would create a more prosperous, sustainable, and equitable Britain. Rather than the illusory “growth” delivered by borrowing against future generations, this new economic model would enrich the nation by making it more productive. This rebalancing would do more than just alleviate the issues of stagnant wages and debt – it would see Britain as a whole become wealthier, more equal, and reinforce its role as a major technological and industrial power.
DETERRING
DISSAVING
CAPPING CREDIT
One of the main ways to generate corporate profit in the dissaving-driven model is through household debt. As shown earlier in Figure 4, household debt as a share of GDP tripled from 30% in 1980 to 93% in 2009 (Bank for International Settlements, 2020). Although household debt as a share of GDP has fallen since then to 84% of GDP in 2019, this still means that the debt-to-disposable-income ratio among households was roughly 130% in that year (House of Commons Library, 2021).
If British companies are to be weaned off the dissaving- driven model, then the main mechanism which makes dissaving viable in the short-run – household debt – must be capped. The level of household debt must be reduced, relative to both GDP and household income.
The best way to achieve this is to ensure that debt growth does not outstrip income growth. Between 1988 and 2019, household income rose by an average of 5% a year (ONS, 2020a), while during the same period lending to individuals (excluding student debt) rose by an average of 7.3% a year (Bank of England, 2021).
Thus, the government must mandate the Bank of England to guarantee that household debt risesno faster than median household income.
1
PROPOSAL 1
Mandate the Bank of England to guarantee that household debt rises no faster than median household income.
ENDING
HOUSING
SPECULATION
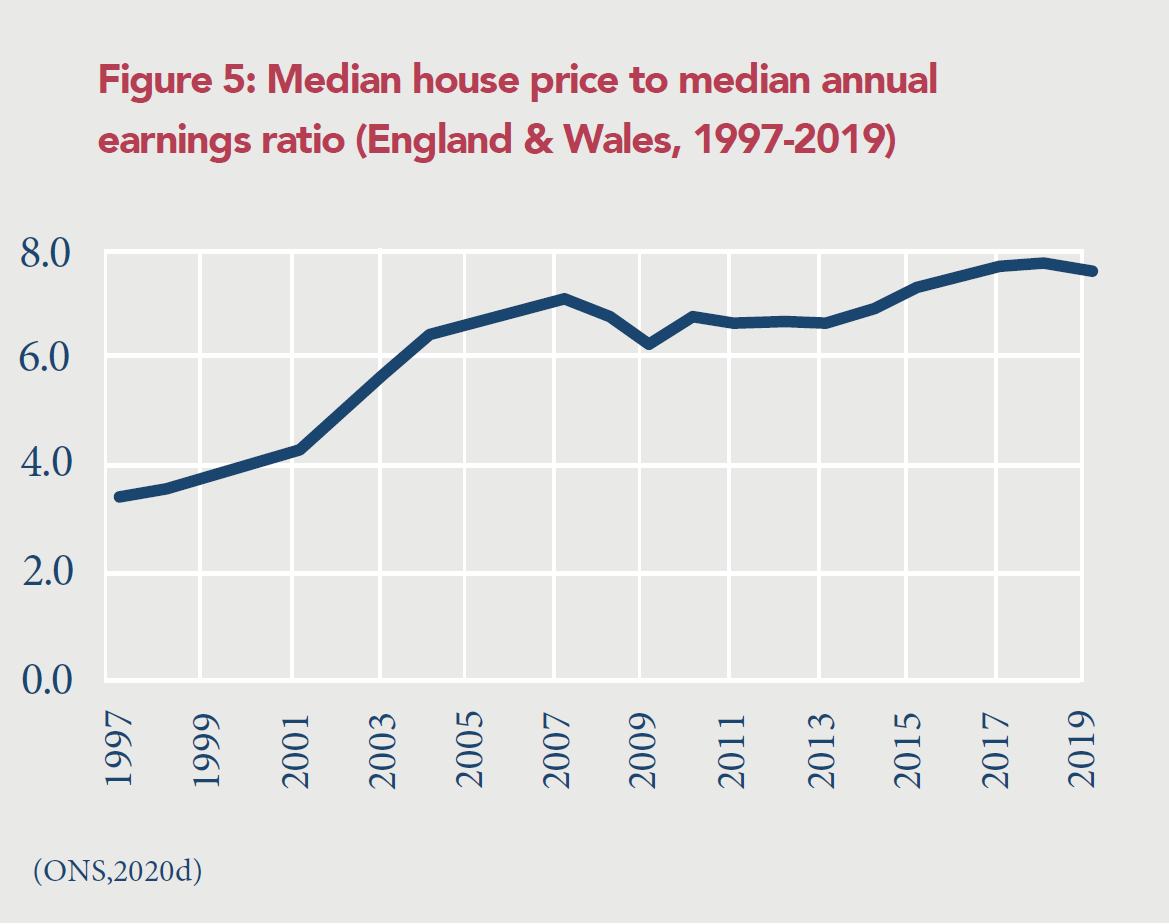
Since 1996, the average UK house price has risen by 160% in real terms. As shown in Figure 5, the ratio of median house prices to earnings in England and Wales has more than doubled since 1997 – the average house is now valued at nearly eight years of median income.
Mulheirn (2019), notes the consensus among economists that a 1% increase in Britain’s housing stock can be expected to lower house prices by 1.5% – 2%. Given that the UK housing stock has consistently experienced such a rise over the past decades, the corresponding rise in house prices can only partly be attributed to a deficiency in supply.
Instead, we must go back to the question of debt. As of 2018, 90.6% of household debt was held in the form of property debt, which mainly consisted of mortgages (ONS, 2019). The ballooning of household debt and the corresponding explosion in house prices are closely related to one-another. All else being equal, greater mortgage finance leads to higher house prices. This causes a vicious cycle of debt growth, because higher house prices will require a greater quantum of future mortgage debt.
The main drivers for heightened demand for mortgages are twofold:
- The introduction of buy-to-let mortgages in 1996 which encouraged a flurry of house purchases from asset-rich investors
- Mortgage rates tumbling over the past decades, with the inflation-adjusted interest rates on five-year fixed-rate mortgages falling from 8% to around 2% in 2019
A perpetual rise in house prices damages the ability of first-time buyers to own property – and to start families – while also serving to siphon income and wealth away from non-owners through increasing rents. It is neither economically and socially desirable nor sustainable.
Sadly, many homeowners and landlords have been encouraged by decades of irresponsible political leaders to treat housing as an asset – rather than a home – which should constantly appreciate. In truth, there is no good reason to assume that house prices should constantly and consistently grow, and such perpetual growth brings profound social harms. While it has become a third rail in British politics, the necessary adjustment cannot be delayed any longer – housing prices, relative to income, must come down.
To end the overvaluation of house prices and help first-time-buyers finally acquire property, both above challenges must be confronted. Our first proposal, to mandate the Bank of England to guarantee that household debt rises no faster than median household income, is an important start. However, it must be built upon.
Since their creation in 1996, buy-to-let mortgages have provided a lucrative means for prospective landlords to acquire rental property for little upfront investment, and often very little risk. As a result, buy-to-let mortgages can be identified as one of the principal drivers of rises in house prices and rent. Therefore, the government must impose a moratorium on buy-to-let mortgages and re-mortgages.
2
PROPOSAL 2
Impose a moratorium on buy-to-let mortgages
REVIEWING
THE INTEREST
RATE
In addition, ultra-low interest rates have only served to deliver illusory and fragile growth by making money cheap. This further inflates asset prices, encourages further levels of unsustainable debt and discourages saving by households.
Since the financial crisis of the late 2000s, the Bank of England has become hostage to artificially inflating consumption through setting and holding ultra-low base rates. Fearing the inevitable short term contraction that must come from reigning in unsustainable levels of debt, the Bank of England has continually avoided the issue of raising interest rates, with members of the Monetary Policy Committee now openly contemplating negative interest rates.
Limits must be imposed on the Bank of England to end this short-term perspective, and to remove its ability to set a base rate that harms long-term prosperity. To do so, they must be given a quantifiable lower bound which reflects the current needs of the economy.
Thankfully, such a limit exists in the form of the natural rate of interest, which is the interest rate that would support the economy at full employment while keeping inflation constant, and which can be calculated through economic modelling – it is currently estimated at around 1.9% (Evans,2020).
Thus, government must leverage this data and require the Bank of England to set the base rate no lower than the natural rate of interest.
3
PROPOSAL 3
Prevent the Bank of England from setting the base rate below the natural rate of interest.
RAISING
INVESTMENT
CLOSING GLOBAL
LABOUR MARKETS
At the very heart of the relative decline in investment are conditions in the labour market. Over the past forty years, labour markets have become ever-more ‘flexible’, owing to a combination of conscious political choices, the unanticipated over-relaxation of national borders, and technological change.
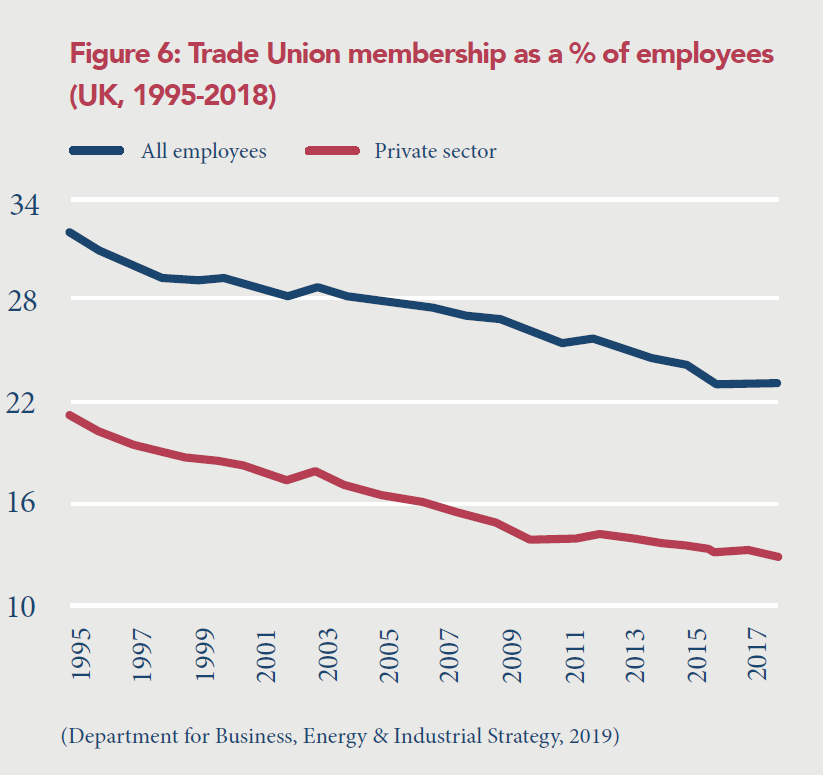
This is exemplified by the continued decline in trade unionism, which is a strong indicator of workforces that are rooted and have a powerful bargaining position with their employers. Trade union membership levels peaked at 13 million in 1979; they fell sharply throughout the 1980s and early 1990s and have declined steadily since. As shown in Figure 6, trade union representation as a whole – especially in the private sector – has continued to atrophy over the past decades.
These increasingly flexible and mobile labour markets have led to the erosion and breakdown of traditional expectations and loyalties between labour and management. This is deeply corrosive. In such an environment:
- Labour has less expectation that management will care about them, and consequently will be willing to change employers more often
- Management has less expectation that their workforce will stay in the long-run, and so has less interest in training and investing in their employees
This mutual lowering of expectations means that both employers and employees become less willing to invest in each other, which caps productivity growth and real wages.
4
PROPOSAL 4
Limit net migration to 50,000 per year.
5
PROPOSAL 5
Apply a modifier to a company’s corporation tax burden, reflecting the median amount of time employees spend with the company.
Over the last decades, these tendencies have accelerated as businesses have had access to essentially unlimited ‘casual’ labour, mainly from Eastern Europe. Between 2004 and 2019, Eastern Europeans accounted for 48.2% of the total rise in UK employment (ONS, 2021a).
Faced with the choice of raising output by either a) investing in new plant and equipment to raise output per worker or b) introducing temporary workforces from Eastern Europe, too often the rational – but short-term – choice has been the latter. So, along with damaging domestic training efforts, over-reliance on open international labour markets has deterred investment in the capital goods that would provide long-term expansion of the economic base.
Prior to the late 1990s, net immigration seldom exceeded 50,000 per year. Since then Britain has experienced a wave of net migration with no precedent in the nation’s history, with net migration having remained above 100,000 since 1998 and averaged 251,600 per year throughout the 2010s (ONS, 2020e).
Astonishingly, in certain 12-month periods since the year 2000, more people migrated to Britain than had been the case in the whole period from 1066-1950 (Goodhart, 2013, p. xxix).
Any strategy aiming to encourage greater domestic investment in human and physical capital must start by accepting that hyper-open labour markets are not viable. Thus, the government must end the post-1997 era of mass migration and limit net migration to 50,000 per year.
RESETTING
EMPLOYER
INCENTIVES
Reducing access to international labour markets is an important first step on reducing the flexibility of Britain’s own labour market. However, it also requires incentives for employers to care about their employees, encourage investment, and raise the expectations between management and workers.
A novel solution is needed to shift the incentive structure for labour relations, so that investment in workers becomes a positive-sum game for both employers and employees.
To achieve such a shift in the incentive structure, we call for a rework of the framework of corporation tax to reward strong and rooted relationships between employees and employers. The tax system should recognise the difference between employers who look after, retain and develop their workforces, and those whose business models depend on casual labour.
Using the ‘polluter pays’ principle, those businesses relying on the casualisation of their workforce should be taxed at a higher rate than those who look after their workforce well. This would be judged by tracking the median amount of time a company’s employee has been with the company (adjusted per sector), with this measurement included in the annual financial audit.
This tax differential would reset the incentive structures for a company’s management, so that when managements must choose between investing in plant and equipment, or hiring casual labour, the incentives will tilt towards the productivity -raising former option.
Under this system, employers who underinvest, undertrain or simply mistreat their workforce, would be unable to retain their staff and would consequently pay a price for it in higher corporation tax. Conversely, ‘good’ employers who invest in and develop their staff will be rewarded for their contribution to the community, and the tax advantage would add to that company’s overall competitive advantage.
PROMOTING
RESEARCH &
DEVELOPMENT
Research and development (R&D) are the means by which the productivity of capital, labour and land are improved. In the long run, this investment is one of the most crucial means by which a society is enriched.
Britain should be a natural hub for investment into research and development initiatives. The United Kingdom hosts several of the world’s most acclaimed research universities, is the nation of origin of the global lingua franca, and is the birthplace of the industrial revolution.
Despite this, UK R&D expenditure across the public and private sectors represented just 1.7% of GDP in 2018. By comparison the average R&D spend across the OECD is 2.4% of GDP, with Germany averaging 3.1% (House of Commons Library, 2020).
The government has begun to address this by setting a short-run target for total R&D investment at 2.4% of GDP by 2027. However, this is inadequate given Britain’s comparative advantage in this area.
With the business sector performing 68% of R&D (Ibid.), the government’s main tool to raise R&D investment must be through expanding existing tax relief schemes for both small and medium-sized enterprises (SME) and large companies. The expansion of these schemes should target R&D investment rising to 4% of GDP.
6
PROPOSAL 6
Target R&D investment to grow to 4% of GDP
RESETTING
THE TRADE
BALANCE
So far, we’ve focused on two parts of the profit equation: dissaving and net investment. However, there is a third component to corporate profits, which is the balance of trade. As shown by the profit equation, corporate profits can be bolstered by a trade surplus. In this way, generating a trade surplus can serve to help reduce the dependence of corporate profits on dissaving.
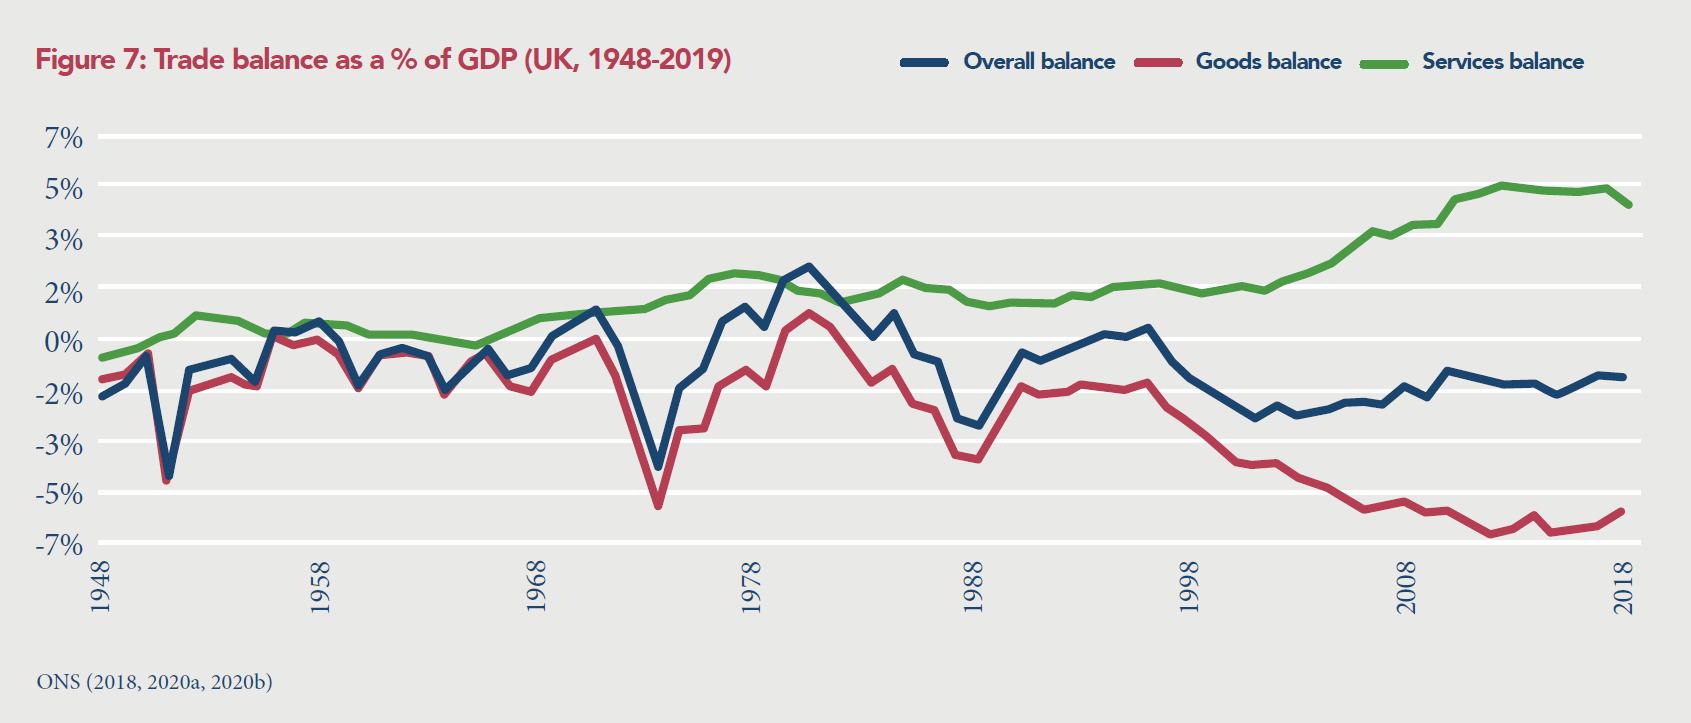
For the past forty years, the story of British trade has been one of an ever-steepening goods trade deficit which has been offset by an ever-climbing services trade surplus – but not by enough to escape an overall trade deficit. As shown in Figure 7, Britain has not run an overall trade surplus since 1997 and has not run a trade surplus in goods since 1981. As of 2019, Britain’s overall trade deficit cost 1.24% of GDP.
In some circumstances, a trade deficit can be a good thing for an economy. A large influx of goods and services can represent a boom for consumers and producers, and kick-start economic growth.
However, in a developed nation, long periods of trade deficits will ultimately harm domestic growth. This is because trade deficits must be financed – which means either taking on debt, selling assets, or selling off equity. All these measures reduce future domestic economic output. If a trade deficit endures then the reduction of an economy’s long-run capacity would far outstrip any short-run boom. The nation would ultimately become poorer.
Since the 1980s, these concerns have been dismissed by the purist advocates of free trade who now dominate policymaking. They argue the following:
a) Britain’s trade deficit in goods has arisen because the imported goods are cheaper than their domestic alternatives
b) Since consumers and producers are saving money on goods, they have more money to spend elsewhere in the economy
7
PROPOSAL 7
Set a targeted goods trade deficit of 3% of GDP.
In practice, this has not been the case. While free trade may improve the purchasing power of consumers, Gudgin (2018) notes that this period has not seen heightened economic growth: whereas per capita GDP grew at just under 3% per annum from 1950-80, it has grown by just under half that since then. Neither has this increased purchasing power from consumers been enough to build their wealth, with household debt nearly tripling since 1980 (see Figure 4).
The key problem with purist free trade theory is that, in the real world, in order to prosper the public must be both consumers and producers. While consumers benefit from slightly lower costs for manufactured goods, this has been more than offset by the macroeconomic effects of free trade, in part because of the loss of manufacturing industry.
Free trade has proven a disaster for many communities whose economies were based on low and mid-skilled manufacturing. Britain’s free trade regime has seen these jobs systematically moved offshore.
Furthermore, gutting our industrial base has spawned the twin side-effects of political alienation and bitter cultural division.
Ultimately, unfettered free trade places downward pressure on employment by destroying ‘uncompetitive’ industries. It also stunts wage growth by forcing domestic workers to compete with cheaper foreign labour that is not subject to similar working condition protections.
Alongside the damage done to jobs, wages, communities and growth, Britain’s trade imbalance has rendered the nation less resilient to shocks such as the Covid-19 pandemic. The contraction of its manufacturing base has induced a reliance on over-extended global supply chains to provide it with manufactured goods, which have proved easy to disrupt, while also causing significant environmental damage.
Hence, reshoring industry and the domestic production of goods must be a key economic goal for Britain in the medium-to-long run. The government should start by targeting a reduction in Britain’s goods trade deficit to 3% of GDP, down from roughly 6% today. This should be pursued through a continually evolving programme of tariffs, capital controls, and tax incentives to encourage firms to reshore manufacturing.
Discussion: The Road to Bruddersford
The way our economic model has eroded is well illustrated by considering the archetypal example of ‘Bruddersford’.
Bruddersford was JB Priestley’s amalgam of the Yorkshire wool towns he knew so well, places which he described as wearing ‘a grim and resolute look’. In the 1950s and 60s, Priestley envisaged Bruddersford as a ‘little forest of mill chimneys’ most of which are ‘only puffing meditatively, for it is Saturday afternoon’.
Bruddersford’s millionaires made their fortunes selling their textiles to Paris, London, New York, and this export trade made it, at one time, home to the densest population of Rolls Royces on the planet. The World Bank, no less, wrote books about how countries could and should take ‘The Road to Bruddersford’ to secure modest prosperity even when the raw materials were discouraging.
Today, only rags and tatters of Bruddersford’s textile industry remains, and the forest of chimneys have long gone. In their place, the major employers are the (unloved) local authority, the health services needed by its increasingly unhealthy and aging population, and the university. Currently, the scope and size of
Bruddersford’s health services are threatened, because the government wants, or possibly needs, to drive business (ie, the sick) towards a new PFI hospital some 30 miles of inadequate road away. This initiative is needed primarily because the cost of servicing the PFI contract is putting pressure on all other health budgets in the area.
As for the university, although this business has expanded to be Bruddersford’s economic salvation – and welcomed by landlords of both sorts – it is a business with only two substantial sources of revenue: government grants and the debts taken on by its students.
Bruddersford used to earn its profits through investment and exports; now it survives in its reduced state on government and student debt.
A
COMPETITIVE
EXCHANGE
RATE
For decades, successive governments have neglected a crucial policy tool that could be used to encourage investment and reset Britain’s trade balance. This is the exchange rate.
It is a long-established economic truism that, all else being equal:
- An overvalued exchange rate begets cheaper imports and can in some cases dampen inflation. However, overvaluation comes with the cost of making a nation’s exports less competitive, causes imports to outcompete domestic products, and reduces the purchasing power of investments in plant, property, and equipment.
- An undervalued exchange rate can encourage inflation in some contexts and increase the cost of some imports. However, undervaluation also makes a nation’s exports much more competitive, protects domestic firms from foreign competition, and encourages more investment into plant, property and equipment.
Thus, a competitive exchange rate is associated with more jobs, increased investment and thus higher growth. Consequently, any government committed to improving the size of its economic base and encouraging industry should pursue a competitive exchange rate.
Yet despite this sterling remains the world’s most overvalued major currency; UBS’ 2018 Markets Outlook found that, at its then conversion rate of £1 to $1.32, the pound was overvalued by 19% (Martin, 2017).
Since Britain adopted a floating exchange rate in 1971, there has been a great deal of hesitance and indifference by successive British governments in doing anything to ensure the sterling is competitively valued. Rather than pursue an exchange rate that delivers prosperity for the economy, the Bank of England and Treasury have yielded to the belief that short-term market forces must go unchallenged in determining the value of stirling.
8
PROPOSAL 8
Target a competitive exchange rate of 1:1 sterling-dollar parity.
However, as shown by recent examples such as Japan, whose government successively managed to bring the value of the yen to the dollar down by a third between 2013 and 2015, it is perfectly within the power of the government to influence a floating exchange rate (Mills, 2020, p. 219).
Much of the work of encouraging a competitive exchange rate only requires that a government openly commit to it as a policy goal, which will in turn shift market expectations to cause a fall in the pound’s price on global markets.
However, it will also require the government to adopt measures that will push down the demand for the pound on global markets. Encouraging a competitive exchange rate will entail:
- Deterring acquisition of British assets by foreign buyers, through public interest tests on foreign acquisitions and a tax regime to discourage foreign buyouts of British assets.
- Changing the mandate of the Bank of England to no longer support sterling as the Bank’s default position, but instead selling the sterling as required on global markets when its price is too high.
- Providing easy-to-access domestic financing facilities for investment in British businesses, to provide competition against foreign capital to encourage devaluation.
In general, the end goal of these policies will be to encourage sterling to set to a sustainable long-term equilibrium exchange rate that delivers investment, jobs, and growth and encourages a reversal in Britain’s long-standing trade deficit. Given sterling’s current overvaluation, an initial target should be for the government to achieve parity with the US dollar.
RESTORING
NATURAL
CAPITAL
A theme shared by all the economic problems discussed in this paper is that they sacrifice longterm prosperity for short-term gain. On a societal level, this is a classic example of what is called high time preference – a tendency to heavily prefer an immediate payoff, even at the expense much higher future payoffs. British politicians from both major parties persistently make this error.
So far, we’ve examined the costs of an addiction to cheap goods, over-reliance on debt and aversion to investment, which can all be viewed as high time preference behaviours. In addition, Britain’s dissaving-driven model of profit and growth has encouraged another high time preference behaviour: environmental destruction.
Natural capital – the resources provided to us by the environment – is of tremendous importance and is something from which every section of the economy derives value. From natural capital we draw the raw resources that are necessary for our society and economy’s existence: whether it be oxygen, fresh water, crops, fish, or minerals.
All our natural capital has slowly accumulated over the course of the past 4.5 billion years. It cannot be quickly replaced, and its depletion or destruction will impose huge costs on future generations. For this reason, our natural capital must be priced in as part of any economic model which seeks sustainable and long-run growth.
In this century, Britain faces many environmental threats. However, successive governments have procrastinated on real solutions to this issue, owing to an unwillingness to challenge the high time preference of policymakers. Instead of looking at the constellation of environmental issues that are facing Britain, elites and successive British governments have instead chosen to myopically focus on the question of domestic emissions reduction. As we argue in the above discussion section, this is a fundamentally flawed approach.
This approach must change. Britain’s environmental agenda must shift away from a focus on emissions reduction, and towards one of replenishing the Earth’s natural capital.
In practice, this will require a long-term focus in two areas Britain can make a substantive difference:
- restoring the extensive forest ecosystems that once existed across the British Isles
- replenishing the marine environments across the United Kingdom’s exclusive economic zone, which spans 6.8 million square kilometres.
With such a strategy of environmental stewardship within Britain’s territory as a bedrock, Britain must then look to use its industrial and technological prowess to solve underlying global challenges such as the climate crisis and resource usage. Rather than throttling Britain’s economic growth and prosperity, we must use the British economy to forge the tools and techniques humanity needs to prosper beyond the 21st century.
REVOLUTIONISING
ENERGY AND
EMISSIONS
We believe that Britain’s main contribution to preserving and bolstering natural capital cannot be centred on curbing greenhouse gas emissions. Rather, its principal goal should be in leveraging its position as a scientific and technological powerhouse to develop the technologies which may be able to mitigate or reverse the climate crisis.
In particular, the government must directly invest in:
- energy technologies such as grid energy storage, Generation IV nuclear fission reactors (designed and built by Britain) and the ultimate prize of nuclear fusion
- carbon capture and storage technologies
Government must allocate and coordinate these investments under the rubric of an overall energy and emissions technology strategy, which leverages the expertise of science and industry.
As these technologies offer a very high return on investment and will be of global significance, the government’s investment in this strategy should be comparable to the UK Research & Innovation budget (currently ~£8 billion per annum). Initially, government should target an investment of £4 billion per year.
9
PROPOSAL 9
Invest £4 billion more per year in next-generation energy and emissions technologies.
Discussion: Hard truths and the climate crisis
When political leaders and businesses have discussed environmental concerns, they have mostly been preoccupied with reducing Britain’s greenhouse gas emissions. While a noble goal, the problem is that no reduction in Britain’s greenhouse gas emissions, including their entire elimination, can make any significant difference to global emissions. The United Kingdom contributes only 1% of total carbon dioxide emissions, compared to China’s 28% and the United States’ 15%. Britain is towards the bottom of emissions league tables, with per capita emissions lower than they were in the 1850s (Union of Concerned Scientists, 2020).
On a global level, we must face a hard truth: current global policies and agreements regarding emissions have failed, are failing, and will continue to fail. The rise in global greenhouse gas concentrations continues to accelerate, driven by developing nations who are seeking to improve output and living standards – most prominently, China and India.
A plan to tackle climate change that hinges on hitherto impoverished nations curtailing their pursuit of prosperity is not realistic. Despite the long-run risks that climate change poses for China, India, and other developing nations, it is unlikely that they will resist a common pattern for human civilisations: no society in human history has made the conscious decision not to grow, not to expand, and not to deploy its ingenuity and efforts to secure what it sees as its material improvement.
The prime responsibility for growing CO2 emissions now lies with developing nations. A preoccupation with domestic carbon emissions in Britain is, effectively, a displacement activity which diverts attention from environmental restoration which the UK could actually achieve.
CREATING
THE CIRCULAR
ECONOMY
An extra opportunity Britain is well suited for is the development and discovery of how to build and operate a “circular economy”. A circular economy can be understood as an economy in which resources are kept in use for as long as possible – partly by resisting built-in obsolescence- and their maximum value is extracted.
Once a product has reached the end of its service life, a circular economy then works to recover and reuse the raw materials within an item.
Describing in detail what a circular economy would look like is currently impossible: or rather, any such description would be a necessarily flawed exercise in imagination. That is because a circular economy is necessarily a holistic venture, and any effort to develop it within the context of an individual company or industry can only be partially successful.
Nevertheless, the fact that companies in many sectors in many parts of the world are trying to put circular economics into practice indicates that the idea itself is appealing. At the heart of circular economics is an aspiration that resource usage should be as efficient and circular as possible.
In its industrial interpretation, this means that every by-product of every industrial process should be engineered to be the input to another industrial process. By extension, when an industrial product comes to the end of its useful life, its components should be able to be recycled for the next cycle of product: this is ‘cradle to cradle’ resource usage.
This vision of industrial processes may involve recycling, but its ambition goes far beyond that. A circular economic approach would not just dictate how things are made, but also in how they are designed, distributed and ultimately how they are financed or legally underpinned.
The circular economy is an Industrial Revolution in waiting, promising a total change in resource efficiency, which ultimately allows growth and prosperity to be compatible with environmental stewardship. Britain is unusually well-suited to discovering and developing such an Industrial Revolution, not least because historically it has the world’s best record in managing such fundamental and dramatic changes in its economic structure.
By its very nature a circular economy cannot be designed or imposed. However, it is possible to earmark Special Economic Zones entirely and exclusively dedicated to developing Circular economy forms, practices, services and products. Within that SEZ, it would be possible to repurpose VAT to zero-rate inputs of products and services which are themselves certifiably part of the circular economy. For example, when a company uses recycled plastics as a key input, those inputs would be zero-rated for VAT purposes. In theory, a wholly circular product would then enjoy a 20% price advantage over its non-circular competitors.
Moreover, having an entire SEZ dedicated to developing circular economics would also have to involve not merely production and distribution, but all the infrastructure needed to develop these economics. This would encompass design, legal, accounting, production engineering, distribution and financial services.
A sufficiently large circular economy SEZ would attract investment from the range of companies currently working in isolation to develop circular economy practices, and would also attract a talented workforce from across all sectors among those who have a vision of squaring the circle between prosperity and the environment. The practices and innovations developed in these new SEZs could serve as a template for a new industrial model for Britain and the world.
10
PROPOSAL 10
Create new “circular economy” Special Economic Zones with distinct tax and regulatory regimes.
CONCLUSION
For over forty years, corporate profits have grown by gradually undermining the prosperity of everyone else. To function, Britain’s dissaving-driven growth model has diminished the wealth of most of society by plundering savings, requiring onerous debts, making property unaffordable, and suppressing wage growth.
The winners of this model have been the minority whose prosperity is driven by corporate profits and asset prices. They have won by impoverishing those whose prosperity is driven by wages and savings.
We argue that this model is, ultimately, selfdefeating. It is a negative-sum game which creates a poorer, weaker and less stable society. This path is inhumane and destructive. For this reason, we call for the end of the dissaving-driven model.
At the heart of it, this entails that the profit equation must be rebalanced. Businesses must predominantly generate their profits through expanding the economic base, rather through plundering the wealth of the nation via debt.
To achieve this goal, we have set out the following ten proposals:
1. Mandate the Bank of England to guarantee that household debt rises no faster than median household income.
2. Impose a moratorium on buy-to-let mortgages.
3. Prevent the Bank of England from setting the base rate below the natural rate of interest.
4. Limit net migration to 50,000 per year.
5. Apply a modifier to a company’s corporation tax burden, reflecting the median amount of time employees spend with the company.
6. Target R&D investment to grow to 4% of GDP.
7. Set a targeted goods trade deficit of 3% of GDP.
8. Target a competitive exchange rate of 1:1 sterling-dollar parity.
9. Invest £4 billion more per year in nextgeneration energy and emissions technologies.
10. Create new “circular economy” Special Economic Zones with distinct tax and regulatory regimes.
While crucial steps, these proposals alone cannot mark a comprehensive solution to the challenges above. Rebalancing the profit equation will be the most ambitious governmental project since 1945 and will require the use of virtually every economic tool at the disposal of the British state.
A total change in the mindset of the British state must accompany the flagship proposals we have set out. These alone cannot bring an immediate end to the structural problems facing the British people. They can, however, mark an end to forty years of indifference and in doing so set Britain on the path to genuine prosperity.
REFERENCES
Bank for International Settlements. (2020, December 7). Credit to the non-financial sector. Retrieved from https://www.bis.org/statistics/ totcredit.htm
Bank of England. (2021). Further details about total lending to individuals data. Retrieved from https://www.bankofengland.co.uk/ statistics/details/further-details-about-total-lending-to-individuals-data
Department for Business, Energy & Industrial Strategy. (2019, May 30). Trade union statistics 2018. Retrieved from https://www.gov.uk/government/statistics/trade-union-statistics-2018
Evans, A. J. (2020). The Natural Rate of Interest: An Estimate for the United Kingdom. Economic Affairs, 40(1), 24-35. Retrieved from https://dx.doi.org/10.1111/ecaf.12385
Goodhart, D. (2013). The British Dream: Successes and Failures of Post-War Immigration. London: Atlantic Books.
Gudgin, G. (2018). Why we need a new growth model for the UK. In C. Bickerton, Brexit and the British Growth Model (pp. 60-65). Policy Exchange. Retrieved from https://policyexchange.org.uk/publication/ brexit-and-the-british-growth-model/
House of Commons Library. (2020, June 17). Research and development spending. Retrieved from https://commonslibrary. parliament.uk/research-briefings/sn04223/
House of Commons Library. (2021, February 8). Household Debt: Key Economic Indicators. Retrieved from https://commonslibrary.parliament.uk/research-briefings/sn02885/
Kalecki, M. (1954). Theory of Economic Dynamics. New York: Routledge.
Martin, W. (2017, November 17). UBS: The pound is the world’s most overvalued major currency. Retrieved from Business Insider: https://www.businessinsider.com/pound-world-most-overvalued-currencyubs-2017-11
Mills, J. (2020). The Elephant in the Room. London: Civitas.
Mulheirn, I. (2019, August). Tackling the UK housing crisis: is supply the answer? Retrieved from UK Collaborative Centre for Housing Evidence : https://housingevidence.ac.uk/wp-content/uploads/2019/08/20190820b-CaCHE-Housing-Supply-FINAL.pdf
Office for Budget Responsibility. (2021, January 28). Public finances databank 2020-21. Retrieved from https://obr.uk/public-financesdatabank-2020-21/
Office for National Statistics. (2019, December 5). Household debt in Great Britain: April 2016 to March 2018. Retrieved from https://www.ons.gov.uk/peoplepopulationandcommunity/personalandhouseholdfinances/incomeandwealth/bulletins/householddebtingreatbritain/april2016tomarch2018
Office for National Statistics. (2020a, December 22). UK Economic Accounts time series. Retrieved from https://www.ons.gov.uk/ economy/grossdomesticproductgdp/datasets/unitedkingdomeconomicaccounts
Office for National Statistics. (2020b, December 22). Business investment time series. Retrieved from. https://www.ons.gov.uk/economy/grossdomesticproductgdp/datasets/businessinvestment
Office for National Statistics. (2020c, December 22). GDP quarterly national accounts time series. Retrieved from https://www.ons.gov.uk/economy/grossdomesticproductgdp/datasets/quarterlynationalaccounts
Office for National Statistics. (2020d, March 19). House price to workplace- based earnings ratio. Retrieved from https://www.ons.gov.uk/peoplepopulationandcommunity/housing/datasets/ratioofhousepricetoworkplacebasedearningslowerquartileandmedian
Office for National Statistics. (2020e, August 27). Migration Statistics Quarterly Report: August 2020. Retrieved from https://www.ons.gov.uk/peoplepopulationandcommunity/populationandmigration/internationalmigration/bulletins/migrationstatisticsquarterlyreport/august2020
Office for National Statistics. (2021a, January 26). Labour market statistics time series. Retrieved from https://www.ons.gov.uk/employmentandlabourmarket/peopleinwork/employmentandemployeetypes/datasets/labourmarketstatistics
Office for National Statistics. (2021b, January 19). Labour productivity time series. Retrieved from https://www.ons.gov.uk/employmentandlabourmarket/peopleinwork/labourproductivity/datasets/labourproductivity
Panjwani, A., & Reland, J. (2019, June 10). Employment: What’s happened to wages since 2010. Retrieved from Full Fact: https://fullfact.org/economy/employment-since-2010-wages/
Union of Concerned Scientists. (2020, August 12). Each Country’s Share of CO2 Emissions. Retrieved from https://www.ucsusa.org/resources/each-countrys-share-co2-emissions